Listening to Learners
Stay Safe, Stay Informed: How Awareness of Support Services and Safety Relate to Re-enrollment
Introduction
Listening to Learners 2024 links student perspectives on learning and support to institution-level practices and technologies. Connecting institutional and student perspectives enables stakeholders and partners to explore their impact on student success, access and equity, and overall institutional satisfaction.
Listening to Learners is one of three research publications that Tyton Partners runs annually to measure market trends in supporting student success in and outside of the classroom. Learn more about Time for Class and Driving Toward and Degree.
Safety
Safety is a topic that does not get discussed during advising meetings despite strong correlation with likelihood to re-enroll.
Learner Awareness
Learner awareness of student support services needs improvement and could drive re-enrollment

Cost of Basic Needs
Costs of basic needs (internet and device) cause stress for many students; course material costs remain a factor for many when selecting courses
GenAI Use
Generative AI use in teaching and learning and student support services are still nascent but increased familiarity creates opportunity to improve outcomes
Stopped-out Students
Previously stopped out learners are more sensitive to FAFSA delays than continuing students
Equity-Excellence Imperative
Measuring student performance in the classroom and utilization of supports by race, ethnicity, and financial need is still not a common practice
Safety
A sense of safety is essential for students to focus on learning, and it significantly influences their likelihood of re-enrolling.
Students’ sense of safety strongly influences their decision to stay enrolled. However, advisors lack time to discuss physical and emotional safety with students, though it is crucial to them. Fostering a high sense of safety is vital for institutions to create a supportive environment where students feel secure, valued, and motivated to achieve their goals.
Safety topics represent a significant gap in conversations students have with their advisors today. Addressing these topics in advising sessions can help students feel more connected and supported, contributing to a more positive and successful educational experience.
Student and academic advisor perspectives on important topics to cover (sorted by student importance)
- Students
- Advisors
Course selection
Discussing progress towards graduation
Registration for upcoming term
Picking a major or field of study
Career options and interests
Reviewing transfer credit
Financial issues
Changing major or field of study
Setting personal goals
Academic policies
Campus safety
Credit for prior learning outside the classroom
Referrals to other support services
Takeaway:
Students are 4x more likely to want to discuss campus safety issues than academic advisors.
Notes: Survey question: “Advisor meetings can cover a variety of topics. Please indicate whether you think the following topics are important or not important for you to discuss with your academic advisor (regardless of whether you actually cover the topics). The ‘Don’t know / NA’ column is chosen by default, so please make sure to change it (if applicable) to express your opinion.”, student n = 1,439; “Academic advising meetings can cover a variety of topics. Please indicate whether you think these topics are essential for you to discuss with students in your caseload.”, advisor n = 892
Sources: Driving Toward a Degree 2024, Listening to Learners 2024, Tyton Partners analysis
Students’ perception of safety, whether physical or emotional, relates to their decision to stay enrolled. A high sense of safety is critical for institutions to foster a supportive and inclusive environment where students feel secure, valued, and motivated to pursue their academic and personal goals.
Student likelihood to stay enrolled by sentiment around physical and emotional safety
- Extremely unlikely
- Unlikely
- Neutral
- Likely
- Extremely likely
Physical safety
Lowest confidence in physical safety
Highest confidence in physical safety
Emotional safety
Lowest confidence in emotional safety
Highest confidence in emotional safety
Takeaways:
For physical safety: Students who express the highest levels of physical safety on campus are 12 percentage points more likely to stay enrolled than students who express the lowest levels of physical safety.
For emotional safety: Students who express the highest levels of emotional safety on campus are 16 percentage points more likely to stay enrolled than those students who express the lowest levels of emotional safety.
Notes: Survey questions: “How likely are you to stay enrolled at your college/university or enroll at any other college/university next term?“; ”To what extent do you agree or disagree with the following statements? I feel physically safe at my college/university.”; “To what extent do you agree or disagree with the following statements? I feel that I am able to express myself freely with others at my college/university”; Safety questions are asked on a 5-point scale from Strongly disagree (lowest confidence) to Strongly agree (highest confidence); Don’t know/NA excluded, n = 1,404-1,406
Sources: Listening to Learners 2024, Tyton Partners analysis
Learner Awareness
Low awareness of student support services limits their impact.
Institutions invest in student support services expecting students to use them, yet awareness of key services like academic and career advising, financial aid, and mental health counseling is only about 50%.
Awareness is particularly low among fully online students, students with disabilities, and stopped-out students. Importantly, those more aware of services are more likely to re-enroll. The awareness gap points to ineffective communication, hindered by poor coordination and uncertainty about how to reach students.
For all students:
Large gaps persist between availability, awareness, and utilization, heightening the potential for increased awareness to affect student outcomes.
While most supports are available at most institutions, student awareness—and consequently utilization—varies dramatically by support service.
For students with disabilities:
Gaps across availability, awareness, and utilization of supports are particularly significant for specific student sub-populations. Students with learning or physical disabilities report lower awareness of key supports, including a ~30 percentage-point decline in awareness of academic advising and financial aid counseling compared to the total student population. This results in stark contrasts in support utilization as well.
While utilization of IT assistance and campus security is higher for this population, only 1% of students with disabilities have used tutoring and academic support at their institution.
For fully online students:
Fully online students also report lower rates of awareness and utilization of support services. Though awareness of mental health counseling is on par with the total student population (and utilization is, in fact, higher), and utilization of IT assistance also peaks for this learner population, awareness and utilization of other supports are concerningly low.
Explicit and intentional outreach to online learners is crucial to ensuring awareness. There are potentially few avenues for students to find out about support services otherwise.
Institutional availability, student awareness, and student use of support services
- Institutional availability
- Student awareness
- Student use
Academic advising
Accessibility/Disability services
Library and research assistance
Tutoring and academic support
IT or technology assistance
Academic registration/Registrar
Campus police/security
Career advising
Mental health counseling
Financial aid counseling
Military/VA benefits
Emergency assistance
Student health clinic
Peer mentoring
Student success coaches
Notes: Survey questions: “Which of the following student support services are available to students at your institution? Select all that apply.”, n = 1,863; “Which of the following support services are available to you at your college/university? Select all that apply.”, n = 1,526; “Which of the following support providers have you ever personally interacted with at your current college/university? Select all that apply.”, n = 1,449
Sources: Driving Toward a Degree 2024, Listening to Learners 2024, Tyton Partners analysis
- Institutional availability
- Student awareness
- Student use
Academic advising
Accessibility/Disability services
Library and research assistance
Tutoring and academic support
IT or technology assistance
Academic registration/Registrar
Campus police/security
Career advising
Mental health counseling
Financial aid counseling
Military/VA benefits
Emergency assistance
Student health clinic
Peer mentoring
Student success coaches
Notes: Survey questions: “Which of the following student support services are available to students at your institution? Select all that apply.”, n = 1,863; “Which of the following support services are available to you at your college/university? Select all that apply.”, n = 325; “Which of the following support providers have you ever personally interacted with at your current college/university? Select all that apply.”, n = 325
Sources: Driving Toward a Degree 2024, Listening to Learners 2024, Tyton Partners analysis
- Institutional availability
- Student awareness
- Student use
Academic advising
Accessibility/Disability services
Library and research assistance
Tutoring and academic support
IT or technology assistance
Academic registration/Registrar
Campus police/security
Career advising
Mental health counseling
Financial aid counseling
Military/VA benefits
Emergency assistance
Student health clinic
Peer mentoring
Student success coaches
Notes: Survey questions: “Which of the following student support services are available to students at your institution? Select all that apply.”, n = 1,863; “Which of the following support services are available to you at your college/university? Select all that apply.”, n = 490; “Which of the following support providers have you ever personally interacted with at your current college/university? Select all that apply.”, n = 490
Sources: Driving Toward a Degree 2024, Listening to Learners 2024, Tyton Partners analysis
Student likelihood to stay enrolled by number of student support services aware of
- Extremely likely
- Likely
- Neutral
- Unlikely
- Not at all likely
Aware of 1-4 Support Services
Aware of 5+
Awareness is positively correlated with an increased likelihood to re-enroll. We observe a statistically significant uptick in the likelihood to re-enroll if a student is aware of 5 or more student support services.
Takeaway:
There is a 13 percentage point increase in the percentage of students likely to stay enrolled and the amount of support services they’re aware of.
Notes: Survey questions: “How likely are you to stay enrolled at your college/university or enroll at any other college/university next term?”; “Which of the following support services are available to you at your institution? Select all that apply”, (15 options provided), n = 319. The difference between 64% and 77% is significant at the 95% confidence level.
Sources: Listening to Learners 2024, Tyton Partners analysis
Institutions make efforts to communicate to students about support services through multiple channels. However, active communication methods (see bolded options) are less frequently deployed today. These active methods can better address student preferences around communication (e.g., timing).
Communication method deployed by institutions
Campus website
New student orientation
Email communication (e.g., weekly newsletter)
Course syllabus
Student handbook
Source systems (LMS or SIS, e.g., D2L, Blackboard, Banner, Anthology Student)
School-run social media accounts^
Periodic information sessions
Mobile messaging (e.g., text, Slack)
Other
Notes: Survey questions: ”How does your institution communicate the availability of student supports to students? Select all that apply.”, n = 1572; “In what format have you interacted with the following support services? Select all that apply.”, “In what format would you most like to interact with the following student supports? Select top 2.”, n = 300-475
Sources: Driving Toward a Degree 2024, Listening to Learners 2024, Tyton Partners analysis
Institutions recognize student communication can be improved and cite a lack of departmental coordination and uncertainty about channels as top barriers.
Institutional opinions on communication effectiveness
- Strongly disagree
- Disagree
- Neutral
- Agree
- Strongly agree
“My institution effectively communicates information about student support services to students”
Notes: Survey questions: “Please select your level of agreement with the following statement: My institution effectively communicates information about student support services to students.”, “Don’t know” is excluded, n = 1,572
Sources: Driving Toward a Degree 2024, Tyton Partners analysis
Top barriers to effective communication, according to institutions
Lack of coordination across departments
Uncertainty about how best to reach students (e.g., preferred email address, text message opt-in)
Juggling too many responsibilities
Lack of understanding of student preferences for contact
Too many disparate technological tools
Limited budget
Limited understanding of student needs regarding support services
Limited outreach resources
Notes: Survey questions: ”What is the top barrier your institution faces in effectively communicating with students?”, n = 1,270
Sources: Driving Toward a Degree 2024, Tyton Partners analysis
Academic advisors mainly reach out to students through students’ preferred method (institutional email), but overestimate the efficacy of source systems. There is a clear preference by students to be engaged through proactive communication channels such as emails and mobile messaging.
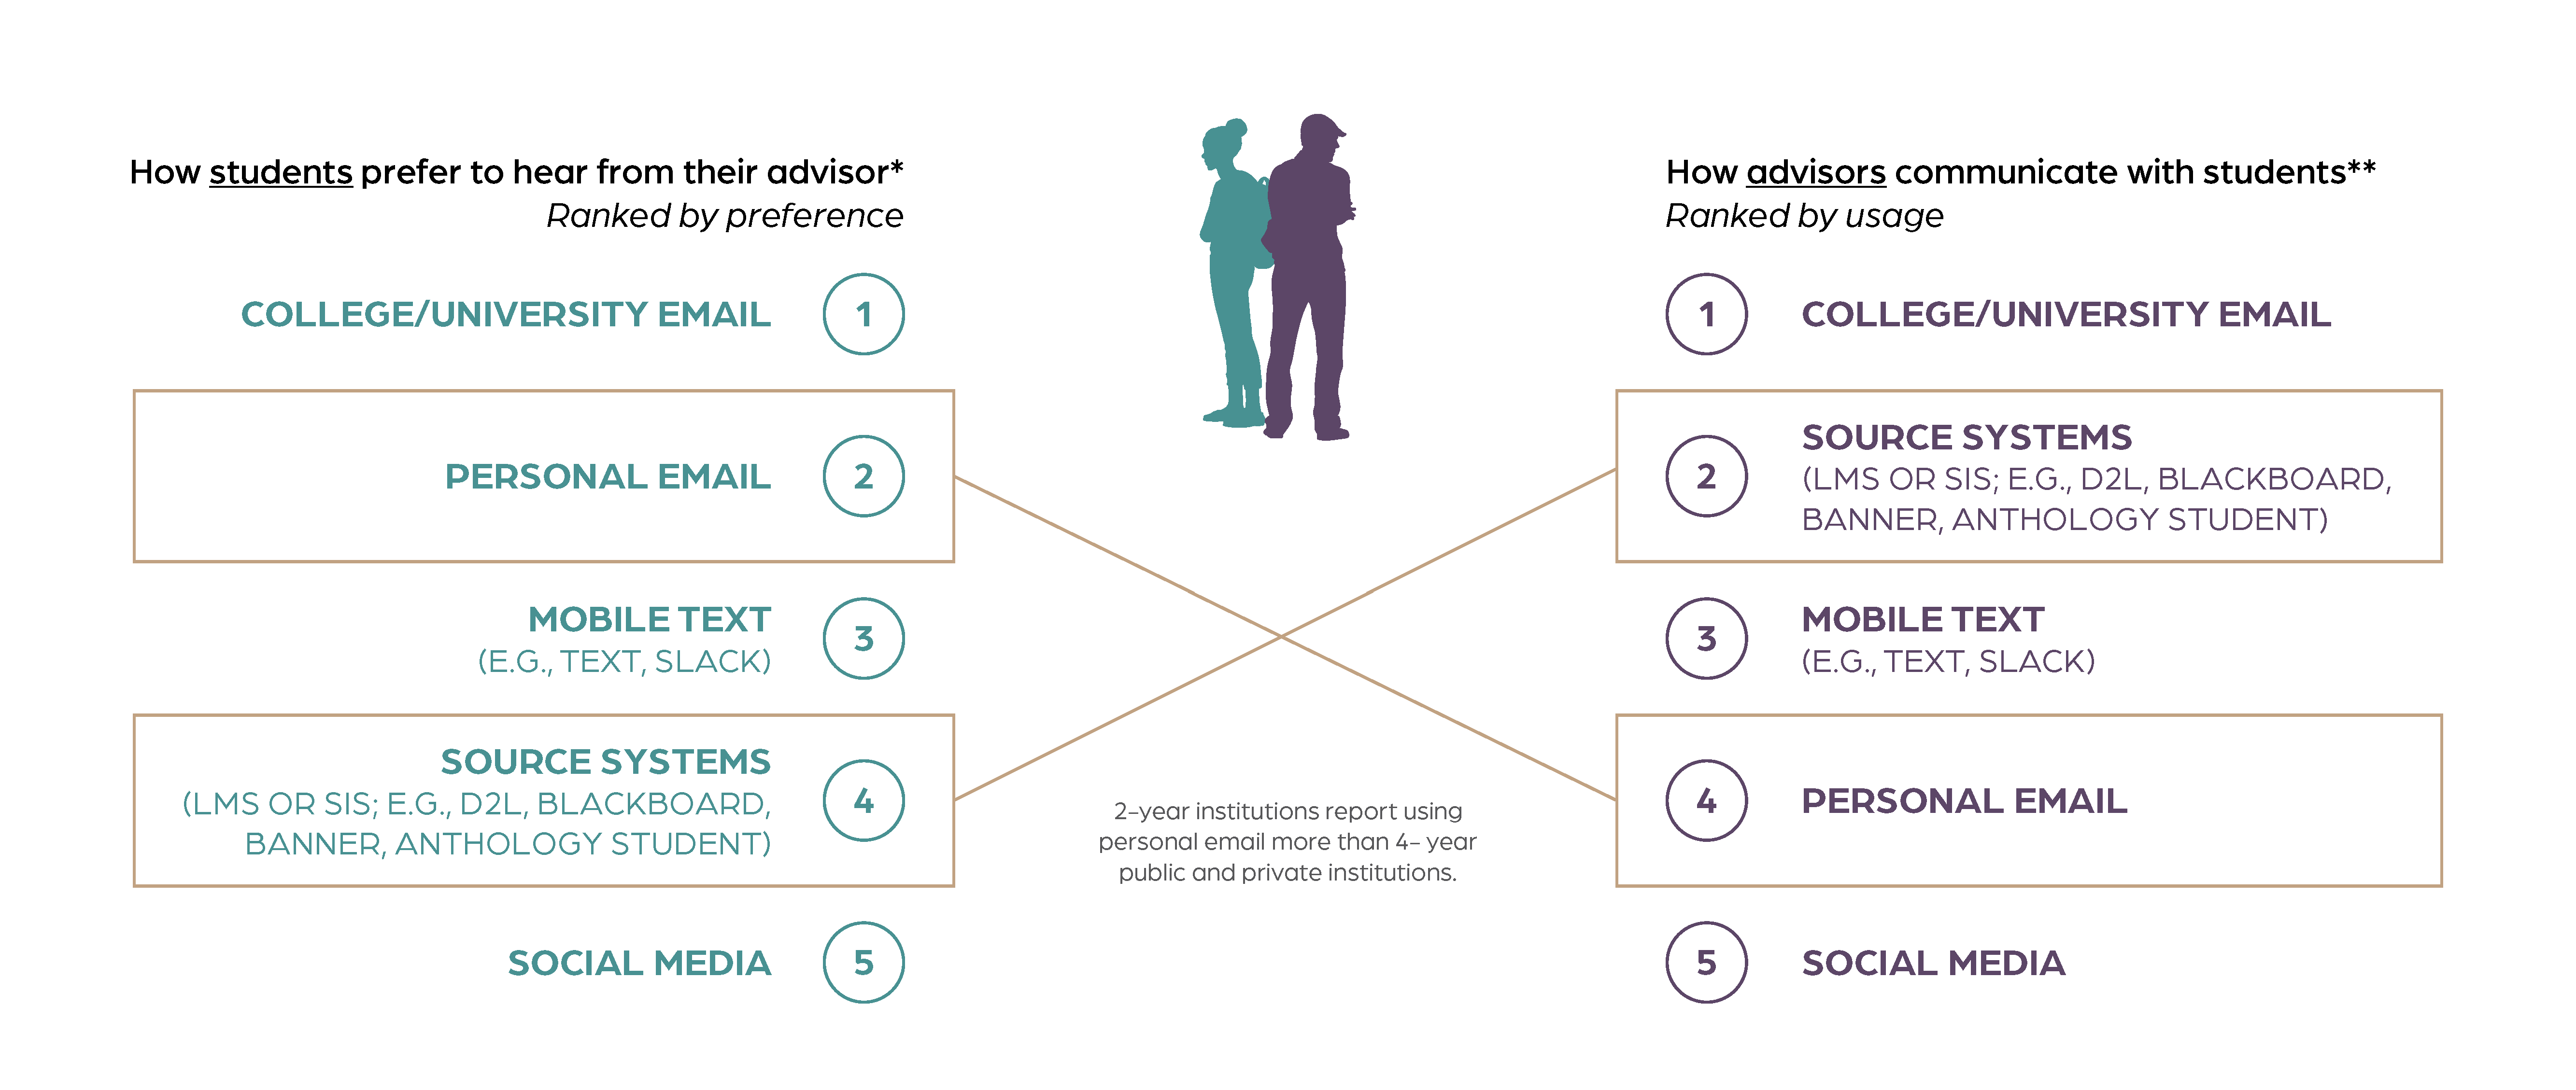
Notes: Survey questions: *“How would you most prefer for your academic advisor to reach out to you? .”, n = 1,439; **”What are the ways in which you attempt to communicate with students assigned to your caseload? Select all that apply.”, n = 805
Sources: Driving Toward a Degree 2024, Listening to Learners 2024, Tyton Partners analysis
Cost of Basic Needs
Direct costs to students must be addressed in and out of the classroom as they impact important academic decisions.
Students are cost-conscious, and institutional stakeholders need to recognize this has a far-reaching impact ranging from access to learning tools and stable internet to individual course selection based on the cost of course materials. Institutions should update attendance costs and pay close attention to course material distribution models to improve equitable access to essential digital learning resources.
Access to basic technology infrastructure is still a need for roughly a quarter of learners who report experiencing stress from internet connectivity issues both on- and off-campus. This experience is exacerbated for students with disabilities, who report higher rates of difficulties with on-campus internet access. A lack of access to basic technology is a severe limitation of digital learning and can hinder student outcomes, given that instructors increasingly teach courses online or incorporate online elements.
Internet connectivity challenges experienced by students
- Experienced, and it was stressful
- Experienced, but not stressful
- Have not experienced
All students
Fully online
First year
First generation
Students with disabilities
Stopped-out
Notes: Survey questions: “Please indicate the extent to which you have experienced the following technology issues as a college student.” Student n=1450-1458 (overall); “Which of the following [list of demographic attributes] applies to you? Select all that apply.” Student n=432 (Fully online), n=314 (First year), n=797 (First generation), n=290 (Students with disabilities), n=725 (Stopped out); *Statistically significant difference (p<.05) in percentage of students with disabilities who indicated they experienced unstable internet connection on campus as stressful compared to all other populations shown
Sources: Time for Class 2024 Survey, Tyton Partners analysis
Technology included as line items in institutional CoA
- Yes
- No
- Don't know
On-campus internet access (WiFi)
Off-campus internet access (WiFi)
Laptop or other computer device
Notes: Survey question: “Which of the following are included as a line item in your institution’s cost of attendance* (CoA)?”; n=316
Sources: Time for Class 2024 Survey, Tyton Partners analysis
Technology support included distinctly in students’ cost of attendance (CoA) is largely limited to on-campus internet access. With 60-70% of administrators reporting that off-campus internet access or devices are not included in the institutional CoA, students are therefore limited in their ability to leverage financial aid to cover these necessary elements of digital learning.
Students’ access (or lack thereof) to basic technological necessities of higher education today has implications for their ability to effectively engage in course content and meet learning goals.
Course material cost as a factor in students’ course registration decision-making
- Not at all a factor
- A minor factor
- One of several important factors
- A major factor
- The sole factor
Overall
2-year
4-year public
4-year private
Cost is a significant driver in students’ decision-making around course enrollment.
Approximately 60% of students, across all institution types and various background experiences (e.g., first-year, part-time, fully online, stopped-out students), indicate that the pricing of course materials is an important or sole factor in their decision to register for a particular class.
Students are price sensitive, and thus institutional stakeholders are justified in placing strong emphasis on the affordability of materials.
When course material costs significantly influence course selection, students might choose a cheaper introductory course that could lead them toward a field of study that doesn’t match their intellectual interests or longer-term career goals.
Notes: Survey questions: “In my decision to register for a course, cost of materials would be…..” Student n=355 (2-year), n=562 (4-year public), n=297 (4-year private)
Sources: Time for Class 2024 Survey, Tyton Partners analysis
Students have a strong and increased preference for Inclusive and Equitable Access models. Of those who prefer digital course materials versus print, 61% would select IA/EA over other digital options, up from 31% in 2023.
Shifts in student preference for accessing digital course materials from 2023 to 2024
- 2023
- 2024
Inclusive access
Equitable access
Borrow each item individually (e.g., from library, friends)
Rent each item individually (e.g., from Amazon)
Buy each item individually
Notes: Survey question: “What best describes how you would most prefer to acquire digital course materials? Select only one.” Student n=798
Sources: Time for Class 2023 & 2024 Surveys, Tyton Partners analysis
Takeaway:
Growing awareness and preference for access models are likely indications of how students value the cost and convenience of this method of procuring course materials.
Percentage of students having access to materials on first day of class by primary access model according to instructors
- Don’t know
- 0-24%
- 25-49%
- 50-74%
- 75-99%
- 100%
Course materials are provided for free
Inclusive Access (discounted fee per course)
Equitable Access (discounted flat fee per term)
Traditional (e.g., bookstore, third party distributor)
Free and Inclusive Access models (78% and 54%, respectively) are most likely to ensure all students have materials by the first day of class, as reported by instructors.
This is in stark contrast to those using traditional models (22%), indicating that Access models do, in fact, effectively enable students to begin courses with the appropriate resources for learning.
Administrators cite the appeal of day-one access as a key reason to offer IA/EA on campus, and instructors generally express optimism about the impact of the access benefits on students.
Notes: Survey questions: “What percent of students have access to materials on day one of class?“; “What is the primary course material access model used in your course?”; differences are statistically significant between respondents selecting “100%”, z=17.6, p<.0001 (free vs. traditional), z=10.3, p<.0001 (IA vs. traditional), z=2.7, p=.006 (EA vs. traditional); from left to right, instructor n=281, n=277, n=99, n=1,027
Sources: Time for Class 2024 Survey, Tyton Partners analysis
Over half of institutions report that the cost of advising technology is a significant barrier to student adoption. Some institutions charge students for student support services, sometimes as part of technology fees and sometimes as a standalone first-year or new student orientation fee. As a result, institutional stakeholders are making concerted efforts to consider direct student costs when making technology purchase decisions.
By prioritizing affordability and accessibility, these institutions aim to ensure that all students have the technological resources necessary to support their success and fully engage with their academic programs. Taking a proactive approach potentially helps to bridge the digital divide and promotes equitable access to education.
Advising technology: Institutional perspectives on cost
- Strongly agree
- Agree
- Neutral
- Disagree
- Strongly disagree
“The cost of technology is a significant barrier to adoption for my institution”
“The cost of technology is a significant barrier to adoption for my institution’s students”
“Cost to student was considered when deciding to adopt technology on campus”
Notes: Survey question: “Please indicate your agreement with the following statements regarding the cost of advising technology to students at your institution.” From top to bottom, n=256, n=246, n=225.
Sources: Driving Toward a Degree 2024, Tyton Partners analysis
GenAI Use
Institutional stakeholders must match students’ familiarity with GenAI tools to better enhance learning and retention outcomes.
Students are ahead of faculty, advisors, and administrators in using generative AI, both free and paid. Many institutional stakeholders are unfamiliar with generative AI, which may limit the technology’s potential benefits for student learning and career outcomes. Student use of generative AI is notably persistent.
In the classroom, instructors who use generative AI tools are more likely to believe in their potential to enhance student learning, despite specific concerns in writing and math classes. Outside of the classroom, advisors, and counselors who use AI tools are also more optimistic about their impact on student persistence and retention. However, face-to-face learners and first-year students prefer human interaction for support, while online learners and upper-level students are more open to AI-assisted support.
The majority of students report regular usage of GenAI tools; in stark contrast, almost 50% of frontline support staff have never used GenAI.
With such a gap in regular usage between students and institutional staff, students are likely lacking support in how to appropriately integrate generative AI tools into their learning. Likewise, instructors are largely not leveraging these tools that have increasingly become part of the higher education digital learning landscape, potentially because they lack the resources or knowledge to do so.
Usage and awareness of GenAI tools Spring 2024
Use very frequently (e.g., daily user)
Use frequently (e.g., weekly user)
Use on occasion (e.g., monthly user)
Have experimented (e.g., have used once or twice)
Familiar but have never used
Not familiar
Notes: Survey questions: “Which of the following best describes your own use of generative AI tools (e.g., ChatGPT) for [school-related] work [or activities]?”, student n = 1,526, instructor n = 1827, administrator n = 306, support staff n = 1,266; *administrators defined as non-academic advising, non-faculty staff holding director positions or above, as well as student affairs and equity professionals, while frontline support providers include academic advisors, other support providers, as well as some faculty
Sources: Driving Toward a Degree 2024, Listening to Learners 2024, Tyton Partners analysis
Adoption of paid generative AI tools
For generative AI users who use monthly, weekly, or daily
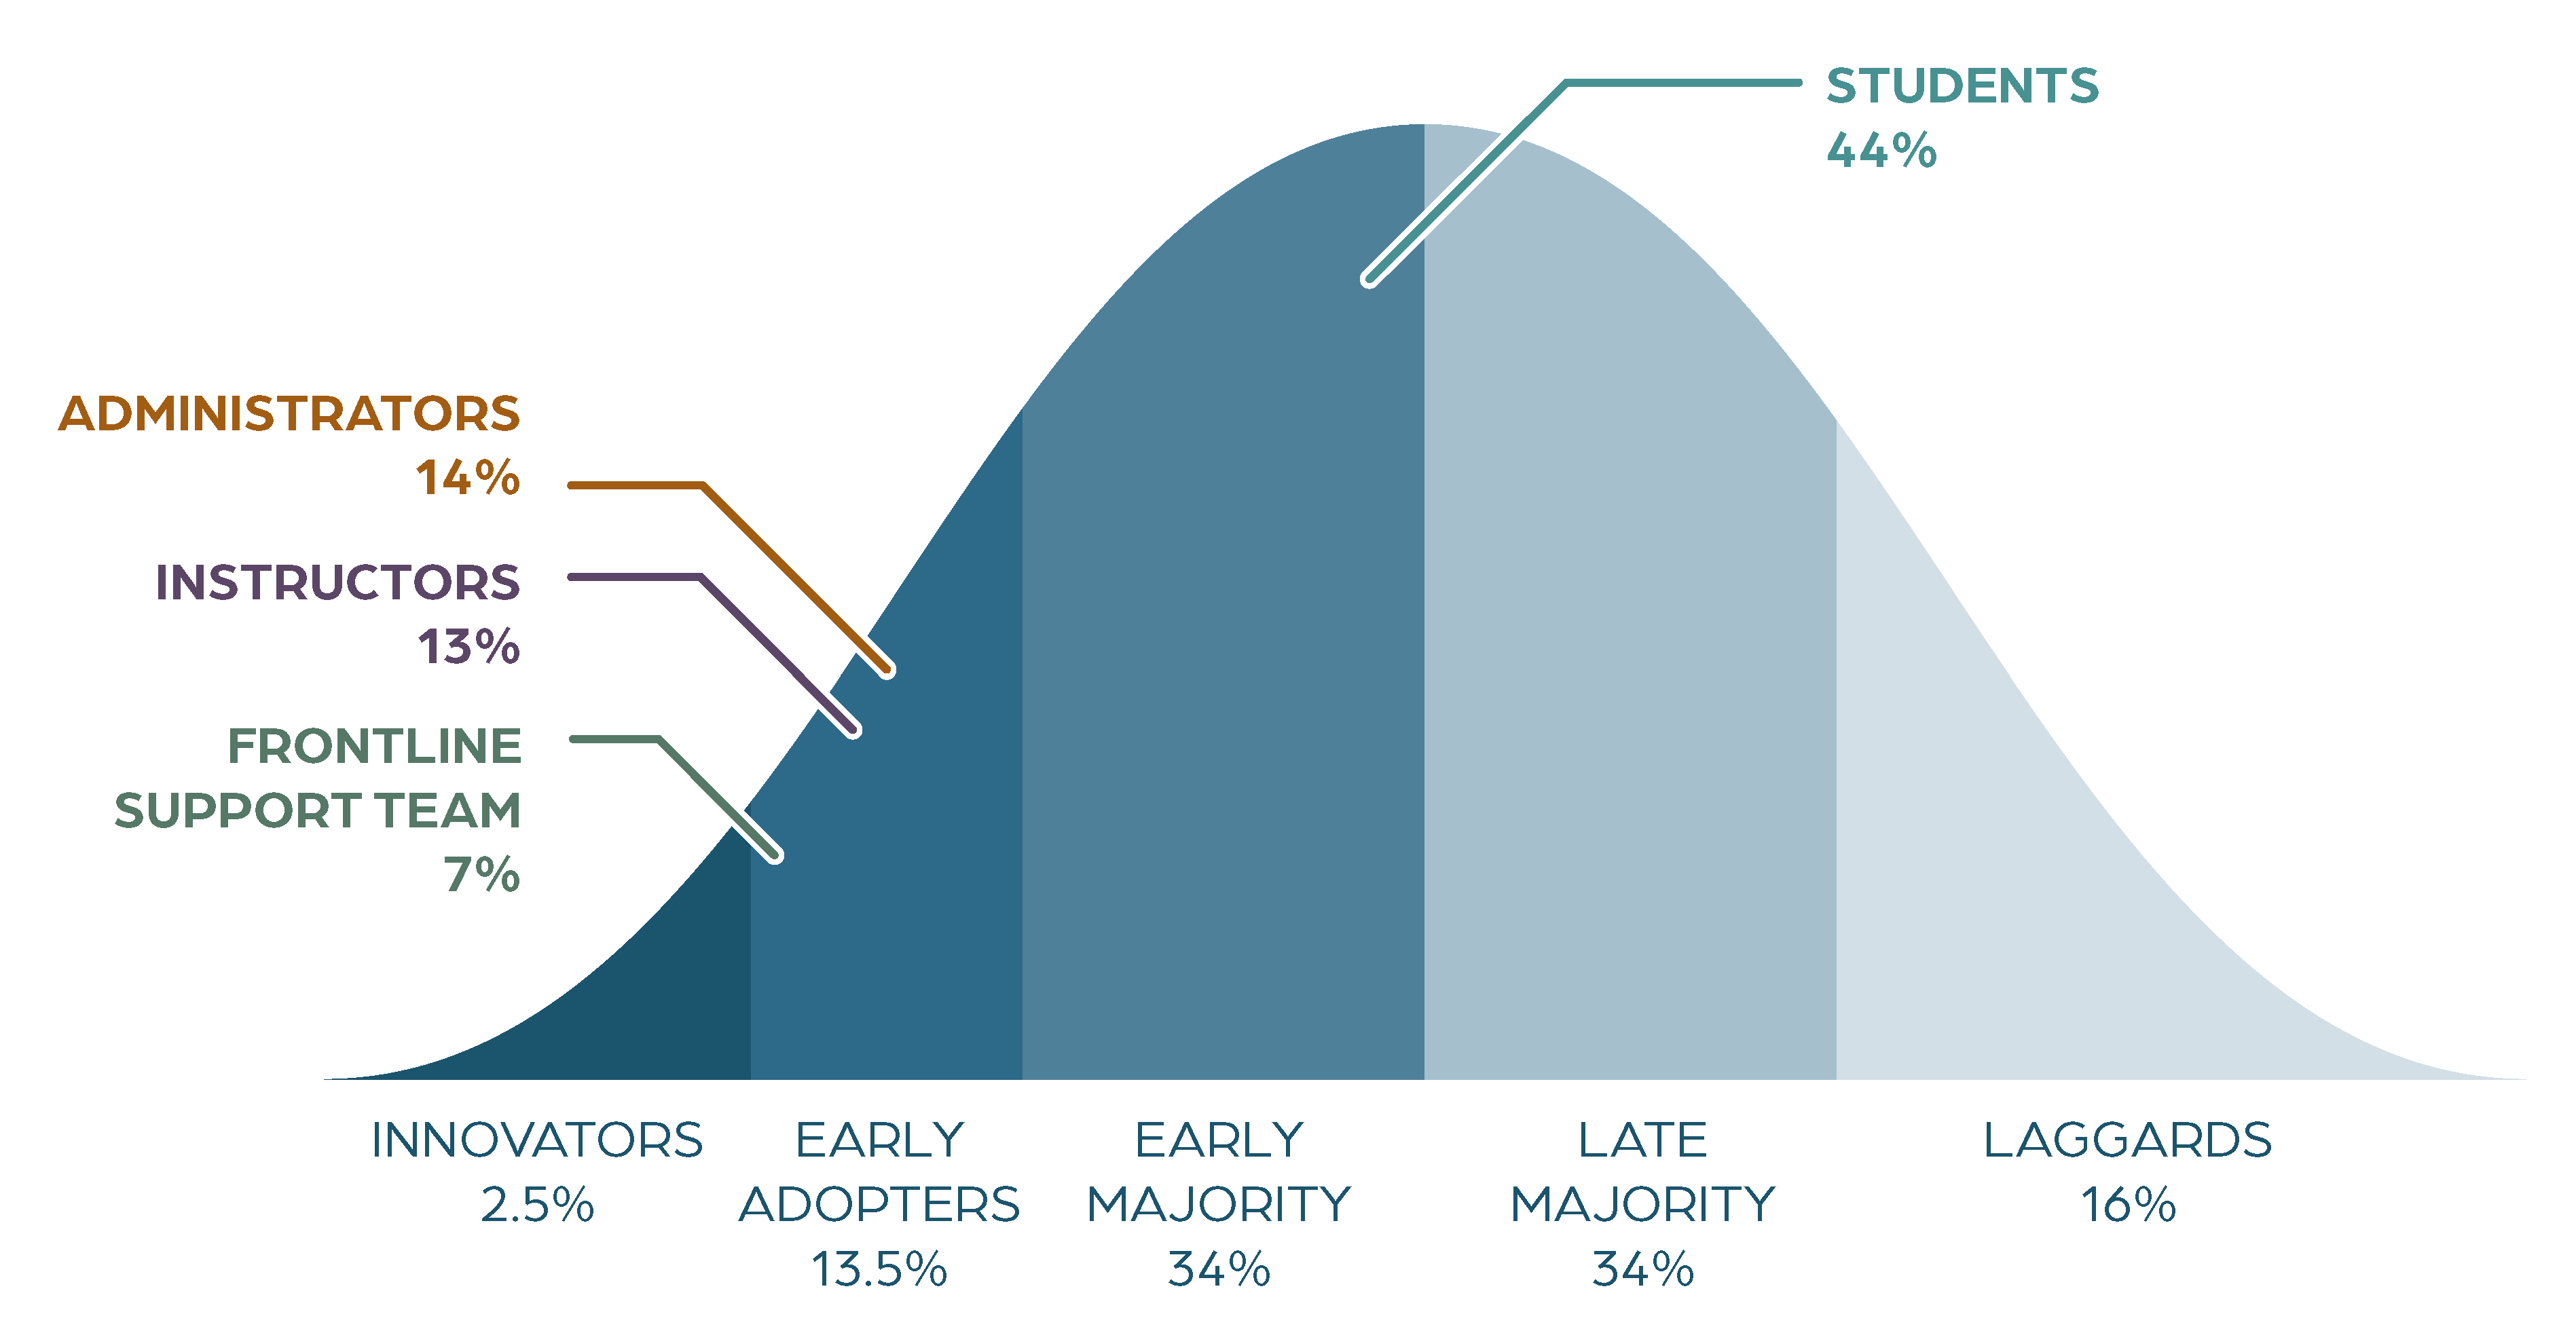
Though institutional AI users are not yet paying for the use of generative AI tools, close to half of students who use standalone generative AI tools like ChatGPT opt for paid AI solutions for their schoolwork.
Takeaway:
Paying for generative AI tools is more prevalent in older learners, fully online learners, learners who are employed while in school, and daily users.
Notes: Survey questions: “Do you pay for the use of any generative AI tools?”, instructor n=654, support service admin n=104, support professionals n=312; “Do you pay for any subscriptions to any generative AI tools or services (e.g., ChatGPT Plus, Cheggmate) that you use for school-related work or activities?”, student n=903
Sources: Time for Class 2024 Surveys, Tyton Partners analysis
Across institutional support service roles, those who use GenAI are more likely to believe in its ability to have positive impacts on student outcomes.
As time goes on, we expect individual adoption of GenAI to increase. Therefore, in the coming years, advocacy for GenAI to improve support services may gain increased traction within institutions.
Institutional belief around generative AI's impact on student outcomes
- Regular generative AI user*
- Has tried
- Never used
"I believe generative AI tools will have a positive impact on student persistence and retention"
"I believe generative AI tools will have a negative impact on student persistence and retention"
100Academic advisors
Financial aid counselors
Career advisors
Mental health counselors
Registrars
Notes: Survey question: “Please read each pair of statements and decide to what extent you agree with one more than the other.” Academic advisors n = 621, financial aid counselors n = 81, career advisors n = 95, mental health counselors n = 81, registrars n = 67; each bucket includes professionals as well as administrators familiar with the support; *“Regular generative AI users” are those who indicated that they use generative AI tools at least monthly
Sources: Driving Toward a Degree 2024, Tyton Partners analysis
Administrators’ and instructors’ perspectives on the impact of generative AI on student learning improve with their own use of and familiarity with generative AI tools.
Those who use generative AI at least once a month are much more likely to believe that these tools will have a positive impact on student learning compared to those who use generative AI less frequently or not at all.
Students, regardless of usage, feel relatively neutral about how generative AI impacts their learning.
Sentiment regarding generative AI's impact on student learning
- Regular generative AI user*
- Has tried
- Never used
"I believe generative AI tools will have a positive impact on student learning"
"I believe generative AI tools will have a negative impact on student learning"
100Administrators
Instructors
Students
Notes: Survey question: “For the following question, please read the pair of statements and decide to what extent you agree with one more than the other.” Administrator n=282 (overall), Instructor n=1418 (overall), Student n=1317 (overall); *“Regular generative AI users” are those who indicated that they use generative AI tools at least monthly
Sources: Time for Class 2024, Tyton Partners analysis
Student trust in generative AI tools by source
- Strongly disagree
- Disagree
- Neutral
- Agree
- Strongly agree
All students
I trust information from publicly available generative AI tools
I trust the information from chatbots powered by generative AI if they were provided to me by my school
Regular GenAI users (monthly or more)
I trust information from publicly available generative AI tools
I trust the information from chatbots powered by generative AI if they were provided to me by my school
Notes: Survey questions: “To what extent do you agree or disagree with the following statements?”, Don’t knows excluded; difference between statements for sum of Strongly agree/agree is statistically significant, p<.05; All students N = 1,388-1,391; Regular Generative AI users N = 894-896
Sources: Listening to Learners 2024, Tyton Partners analysis
Half of students would trust information from school-provided GenAI chatbots, while a slightly smaller proportion already trust information from publicly available tools.
Another third of students are neutral in their trust, potentially indicating their desire for external validation and fact-checking.
Takeaway:
GenAI usage is correlated with trust among students. Almost 60% of regular GenAI users would trust information from school-provided chatbots. As usage increases, both among current users and non-users, comfort and trust in GenAI tools are likely to rise as well—we expect trust among users to rise, with trust among the overall population to follow suit.
Students use generative AI for later-stage writing, which most instructors deem unacceptable. Between 20-40% of second-year+ students will use generative AI for writing significant portions of their assignments, in contrast to 85%-99% of non-gateway instructors who view it as not permissible. There is an urgent need for the creation and communication of institutional policy around acceptable use cases of generative AI tools, particularly in writing courses.
Student acceptable writing use cases for GenAI tools
Brainstorming ideas and research
Outlining structure
Editing
Writing small parts of an assignment
Writing large parts of an assignment
Writing first drafts of an entire assignment
Writing entire assignments unedited
Don’t use generative AI tools for writing
- Humanities (first-year)
- Humanities (second-year+)*
Instructor acceptable writing use cases for GenAI tools
Brainstorming ideas and research
Outlining structure
Editing
Writing small parts of an assignment
Writing large parts of an assignment
Writing first drafts of an entire assignment
Writing entire assignments unedited
Don’t use generative AI tools for writing
- Gateway humanities instructors
- Non-gateway humanities instructors
Notes: Survey question: “In which of the following ways do you currently use generative AI tools (e.g., ChatGPT, Bard/Gemini) for writing assignments? Select all that apply.”, student n=72 (first-year humanities), student n=269 (second-year+ humanities); *includes students who selected “none of the above applies to me” when asked to indicate their year in school; “Please indicate which of the following tasks you would allow students to use generative AI writing tools for in your courses. Select all that apply.” Instructor n=492 (gateway humanities), n=174 (non-gateway humanities)
Sources: Time for Class 2024 Surveys, Tyton Partners analysis
Similar to writing, students use generative AI tools for math homework help in some ways instructors do not consider permissible. There is a 17 percentage point difference between instructors and students around using GenAI for identifying the key elements of a problem or a list of required steps toward solving it. There is a 19 percentage point difference between instructors and students around converting word problems into equations or vice versa.
Permissible math uses of GenAI tools: instructors vs. students
- Instructors
- Students
Explaining concepts or providing definitions
Generating charts or visualization to better understand a problem
Generating new problems for practice or fully completed new example problems
Identifying the key elements of a problem or a list of required steps toward solving it
Restating or rewording problems
Analyzing large data sets
Editing or correcting a problem’s solution(s)
Converting word problems into equations or vice versa
Generating code to assist with data analysis
Inputting text or images of problems to receive solved output
None/I don’t use generative AI tools for math
Notes: Survey questions: “Please indicate which of the following tasks you would allow students to use generative AI writing tools for in your math courses. Select all that apply.” Instructor n=876 who assign math problems in their courses; “What do you use generative AI (e.g., ChatGPT, Bard/Gemini) for in your math studies? Select all that apply.”, student n=903
Sources: Time for Class 2024, Tyton Partners analysis
Takeaways:
Approximately a third of students in math courses use generative AI to identify key elements and steps to solving a problem, as well as to convert word problems into equations to solve—activities that faculty do not find acceptable. Enactment of institutional policies is necessary to clarify acceptable use and maintain academic integrity.
Students are more likely to use generative AI tools even if the tools are banned, and they are less deterred by consequences than in 2023. Thus, the potential impact of generative AI on academic integrity is a top concern, and institutions must continue to develop clear use policies, provide training to faculty, and create strategic approaches to adapting instruction to generative AI’s increasingly sticky use by learners.
Student likelihood of using generative AI tools if institution or instructor banned them
Spring 2023
Spring 2024
- Extremely unlikely
- Unlikely
- Neutral
- Likely
- Extremely likely
Deterrents to using generative AI tools for students
Failing the whole class
Getting a lower grade on my work
Being on a “watch list” for use
I wouldn’t use GenAI tools if I knew they were prohibited
Knowing my instructor used an AI detector
Being suspended from school
Nothing would deter me
- Spring 2024
- Fall 2023
Notes: Survey questions: “If your instructor or college/university banned the use of generative AI tools (e.g., ChatGPT or Google Bard/Gemini) for completing academic assignments, how likely would you be to still use generative AI tools?.”, n=1,326 and 1,147; “If your instructor banned the use of generative AI tools for a class, which of the following potential outcomes (if any) would stop you from using the tools? Select all that apply.”, n=1,147
Sources: Time for Class 2023 and 2024 Surveys, Tyton Partners analysis
Institutions have made progress towards established policies related to student use of generative AI tools since 2023, but 76% have yet to develop and roll out a policy. Simultaneously, of the students who are aware of generative AI tools, 29% are either not aware of a generative AI policy or indicate there is no stated policy at the institutional level.
Institutional action towards policy creation, as well as explicit communication of these regulations, is critically urgent given the increasing adoption of AI tools and widespread concern about academic integrity.
Institutional policy making status: 2023 to 2024
- Spring 2024
- Spring 2023
Developed and rolled out a policy
Actively working on developing a policy
Expecting institution will begin working on developing a policy soon
Not expecting institution will make a policy in the foreseeable future
Don’t know
Notes: Survey question: “Has your institution developed an institution-wide formal policy with respect to generative AI writing tools like ChatGPT?”, Administrator n=233 (2024), Administrator n=168 (2023)
Sources: Time for Class 2023 & 2024 Surveys, Tyton Partners analysis
When supports are particularly relevant to a student’s situation, students are more likely to prefer human interaction with supports.
For example, first-year students are inexperienced in course registration and financial aid, and they may seek additional support around their academics, career interests, and mental health. As a result, they may seek more personal, human-centered assurance and support.
Student preference for use of professionals vs. generative AI in support services
- First-year students
- Non-first-year students
"I prefer interacting with professionals only"
1"I prefer interacting with automated/GenAI services only"
5Course registration
Academic advising
Financial aid
Career advising
Mental health
Notes: Survey question: “In addition to applications around schoolwork, generative AI tools can be also used for student support services. Generative AI tools have lots of possible benefits related to providing student support services, though there are also possible limitations associated with the technology. We would like to better understand where you see the benefits and limitations of generative AI tools. Please indicate the extent to which you would prefer your college/university use generative AI tools to provide student support services. Please indicate an answer for each type of support service.”, first-year n = 298, non-first year n = 1,114
Sources: Listening to Learners 2024, Tyton Partners analysis
In contrast, fully online students are typically more comfortable with technology, specifically for their education. Fully online students are also more comfortable with a greater degree of automated or generative AI support services, especially in areas such as career advising and mental health.
Student preference for use of professionals vs. generative AI in support services (by modality)
- Face-to-face and hybrid students
- Fully online students
"I prefer interacting with professionals only"
1"I prefer interacting with automated/GenAI services only"
5Course registration
Academic advising
Financial aid
Career advising
Mental health
Notes: Survey question: “In addition to applications around schoolwork, generative AI tools can be also used for student support services. Generative AI tools have lots of possible benefits related to providing student support services, though there are also possible limitations associated with the technology. We would like to better understand where you see the benefits and limitations of generative AI tools. Please indicate the extent to which you would prefer your college/university use generative AI tools to provide student support services. Please indicate an answer for each type of support service.”, first-year n = 298, non-first year n = 1,114
Sources: Listening to Learners 2024, Tyton Partners analysis
Instructor, administrator, and student sentiments toward generative AI
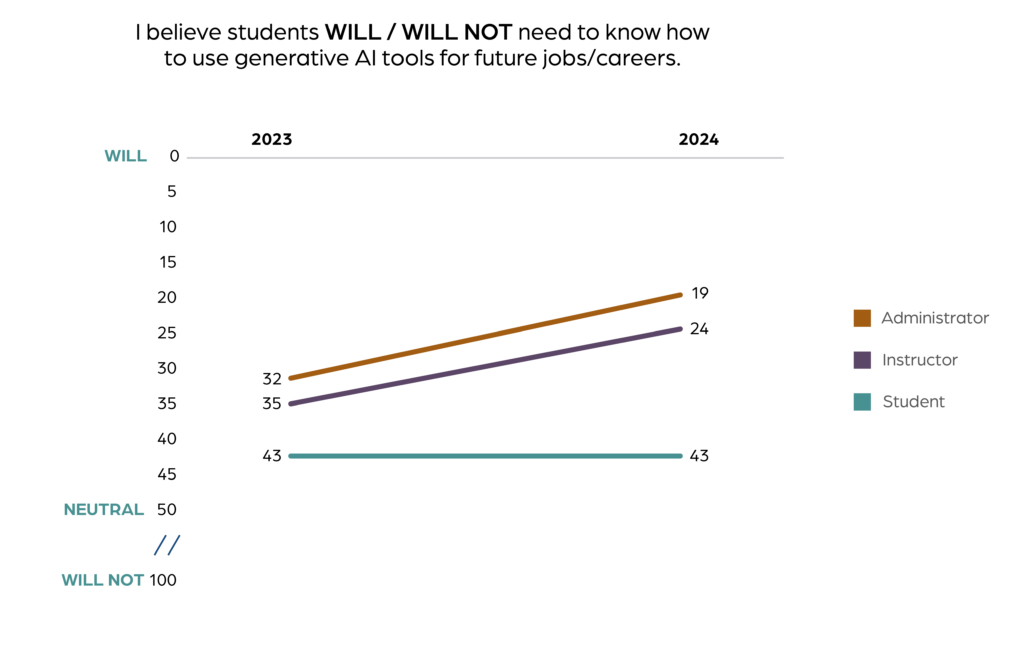
Administrators and instructors increasingly recognize how generative AI tools will impact students’ lives both academically and beyond the classroom.
Students are already using generative AI tools for many purposes today outside of academics. For example, daily users are leveraging the technology in jobs already while in school or using generative AI to create cover letters and resumes.
Notes: Survey question: “For the next few questions, please read the pair of statements and decide to what extent you agree with one more than the other”, Instructor n=1418-1503, Administrator n=150-287, Student n=1,328-1,303
Sources: Time for Class 2023 & 2024 Surveys, Tyton Partners analysis
Stopped-out Students
Stopped-out students and formerly-stopped-out students have unique but addressable needs.
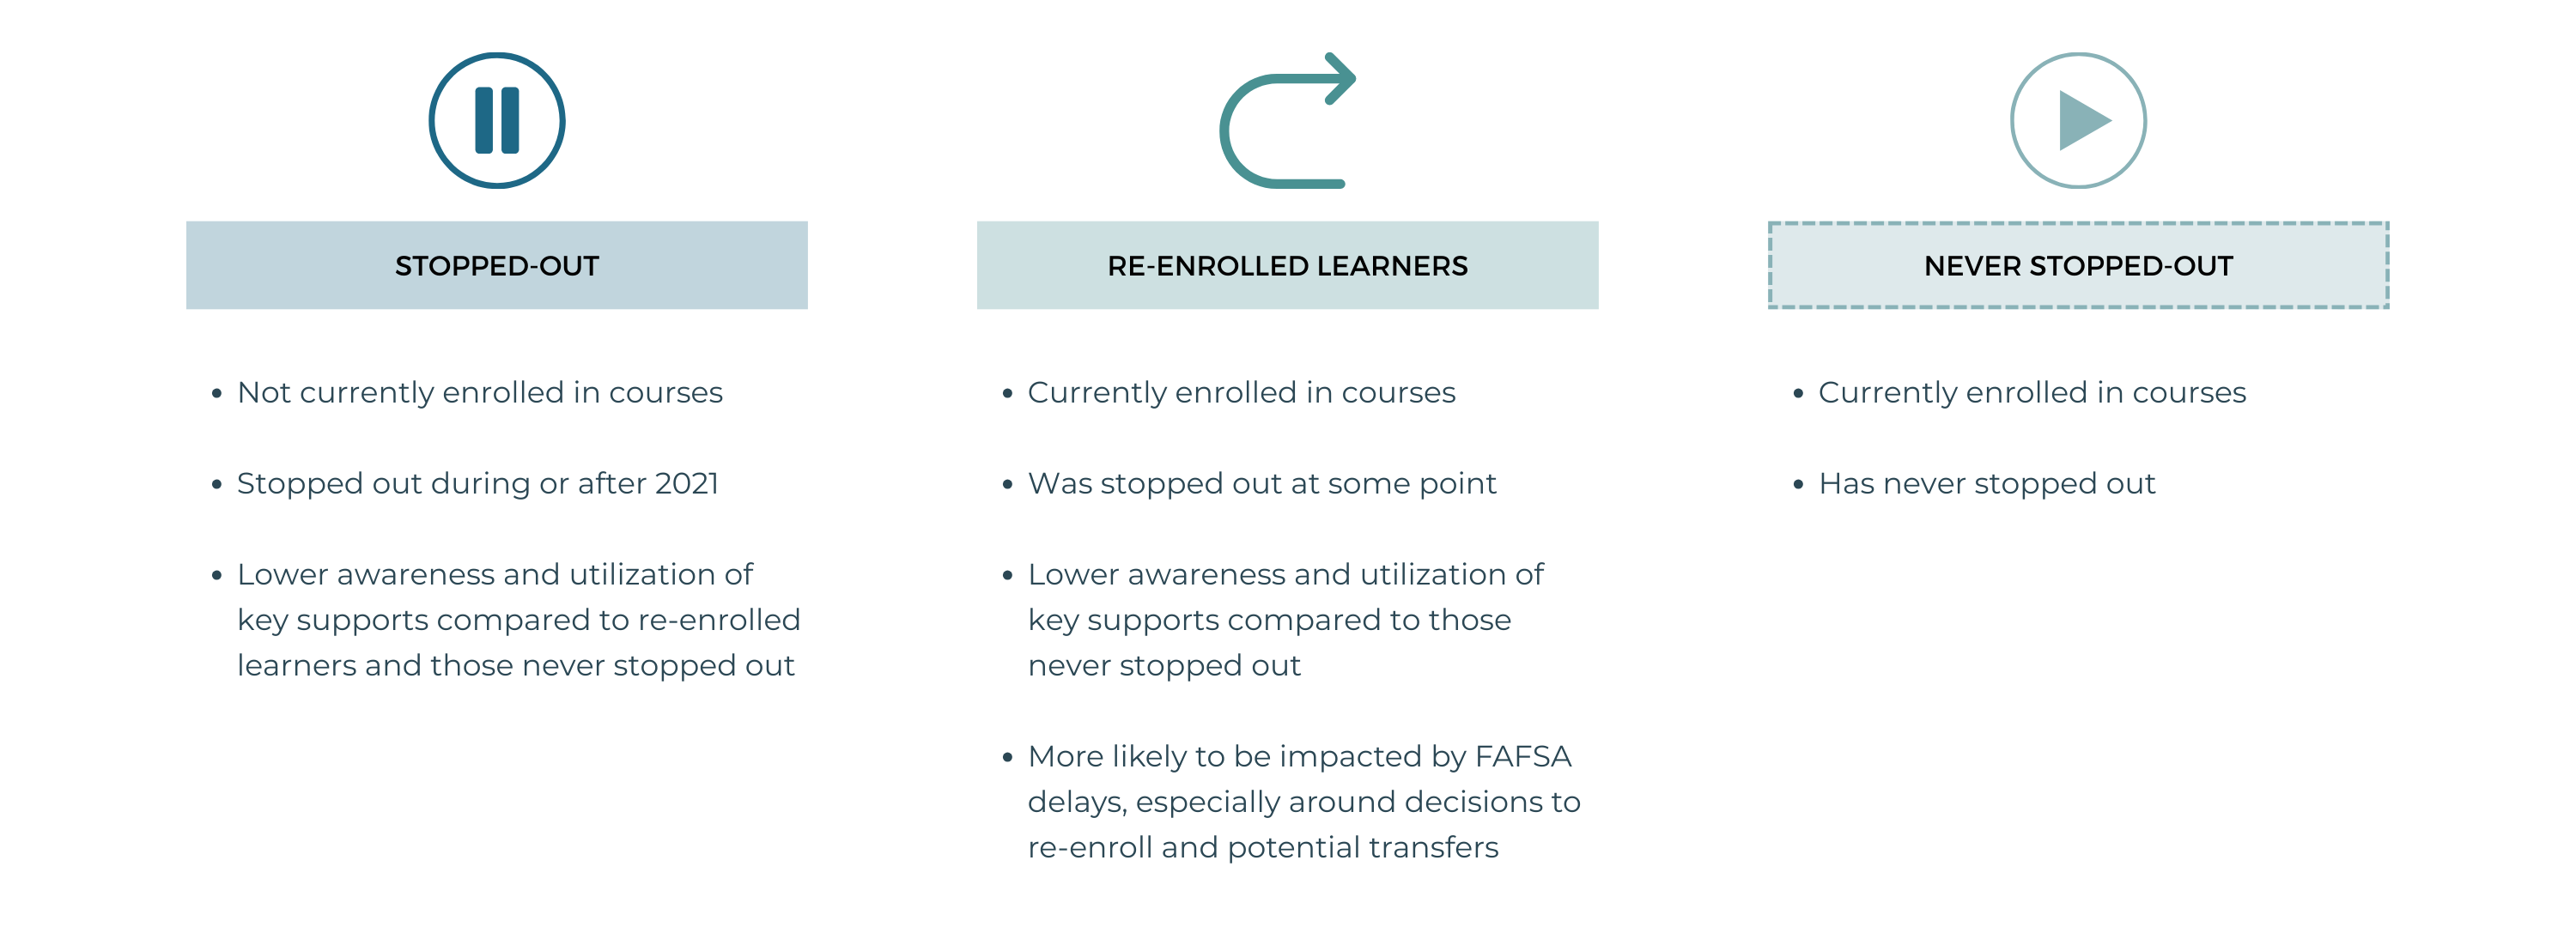
As of July 2022, the National Student Clearinghouse Research Center finds the ”Some College, No Credential” (SCNC) population under 65 has grown to 36.8 million. Stopped-out students are less aware of available support services, and FAFSA delays disproportionately affect them. Addressing their unique needs and raising awareness of student success resources is crucial to improving credential attainment for those who re-enroll.
Listening to Learners 2024 sought to specifically survey stopped-out students to better understand their experiences and behaviors.
Student profiles by stopped-out status
Sources: Listening to Learners 2024, Tyton Partners analysis
Previously stopped out students (not shown below) generally fall between current stop-outs and students who have never stopped out in terms of awareness and utilization.
Awareness and utilization of key supports by stopped-out status
Academic advising
Financial aid counseling
Career advising
Mental health counseling
Notes: Survey questions: (Awareness) “Which of the following support services were available to you at the college/university [in which you were last enrolled]? Select all that apply.”; (Utilization) “Which of the following support providers did you ever personally interact with at the college/university in which you were last enrolled? Select all that apply. “, currently stopped out n = 66, never stopped out n = 772
Sources: Listening to Learners 2024, Tyton Partners analysis
Takeaway:
Currently stopped-out students report lower awareness of key supports, especially mental health counseling, resulting in lower utilization.
Impact of FAFSA delays and modifications on students (by stopped out status)
- Re-enrolled students
- Never stopped out
I have felt stress or anxiety regarding my personal finances
I am waiting to re-enroll until I understand what my federal aid will be for next year
The FAFSA-related stress of the delays negatively impacted my academic performance
I am considering transferring to a different college/university
The FAFSA-related stress of the delays negatively impacted my health and well-being
N/A—I do not anticipate being impacted
Notes: Survey question: “What specific impact have the 2024-25 FAFSA delays and modifications had on you? Select all that apply.” Re-enrolled learners n=447; Never stopped out n=450
Sources: Listening to Learners 2024, Tyton Partners analysis
Takeaway:
FAFSA delays have had disproportional effects on re-enrolled learners’ decisions to re-enroll and potential transfers.
Equity-Excellence Imperative
Excellence without equity does not serve our future workforce.
Targeted Universalism
- Targeted universalism involves setting universal goals and using targeted strategies to achieve them. It establishes goals for all groups and then tailors strategies based on each group’s unique situation within structures, cultures, and geographies. This approach is goal-focused, directing processes toward the universal objective.
- Learn more about targeted universalism.
Targeted Universalism Applied in the Classroom
- For instructors, the universal goal is to improve academic outcomes for all students.
- Measuring where vulnerable student subgroups stand relative to desired academic outcomes is necessary to adapt teaching to better serve each student’s needs.
Targeted Universalism Applied Outside of the Classroom
- The universal goal for student support providers is to provide all students with the services they need at the optimal time and level.
- Identifying awareness and utilization gaps among vulnerable student subgroups is necessary to adapt how services are offered and communicated to students and identify the potential for targeted interventions.
Targeted Universalism Applied in the Classroom
The first step in measuring where vulnerable student subgroups stand in the classroom setting is to disaggregate course-level data.
Analyzing disaggregated course-level data by student race/ethnicity or financial need
- No
- Yes
Administrators report institution encourages
Instructors reporting engaging in
Notes: Survey question: “Which of the following equity-minded practices in digital learning does your institution/do you engage in?.”, Administrator n=320, Instructor n=1,718
Sources: Time for Class 2024 Survey, Tyton Partners analysis
Close to 90% of instructors do not analyze course-level data by student subgroups, and ~80% of administrators do not report encouraging this equity-minded practice.
Primary person responsible for accountability data
- Administrators
- Instructors
Head of Institutional Research
Chief Academic Office or Provost
Deans
Department Chair, or similar
Individual Faculty
Chief Diversity Officer
Course Coordinators
There is no such role at my institution
Don’t know
Notes: Survey question: “Who at your institution is responsible for ensuring that course-level student data that is disaggregated by race and ethnicity is used to improve student outcomes? Select all that apply.”, Administrator n=69, Instructor n=235
Sources: Time for Class 2024 Survey, Tyton Partners analysis
Takeaway:
(Continued from above) Of the minority of institutions that report encouraging the practice of disaggregating course-level data by race/ethnicity or financial need, most administrators say that their head of institutional research is responsible for this kind of data, but over 1/4 of instructors say they don’t know.
So, if this equity data is being captured and analyzed at all, it is most likely not being disseminated to the instructors who hold the most power to utilize it in the classroom.
Targeted Universalism Applied Outside of the Classroom
Identifying and addressing utilization gaps among vulnerable student subgroups is the first step to applying targeted universalism to student support services.
Despite having a perspective on which student populations are most at risk, over half of academic advisors don’t know if student utilization of support services is tracked by at-risk sub-populations. Currently employed students and parents/caretakers may be the most under-tracked and therefore, most underserved.
Among other issues, a lack of awareness of sub-population tracking limits advisors’ ability to tailor meeting topics and referrals to students.
Comparison of student drop-out risk and tracked student support utilization
- Perceived as at-risk of dropping out by institutions*
- Student support utilization tracked by institutions**
First-generation students
Students from underserved racial groups
Students who are currently employed
Students who are parents or caretakers
Students who were previously on leave
Transfer students
Students receiving federal financial aid
Students from a rural area
Students who are active duty military/veterans
International students
Don’t know
Takeaway:
Among other issues, advisors’ lack of awareness of sub-population tracking limits their abilities to tailor meeting topics and referrals to students.
Notes: Survey questions: *“Which student subgroups does your office perceive as particularly at risk of dropping out? Select all that apply.”; **“Does your institution track student support utilization separately for the following subgroups? Select all that apply.” n = 936; omitted answer options with <5% difference in perception and tracking (students with disabilities, part time students, fully online students, ESL students, adult learners, LGBTQ+ students, students with heritage linked to global conflicts)
Students who struggle are often the least likely to seek help. To achieve the universal goal of providing all students with the services they need at the optimal time and level, you need to understand the needs of students who don’t present themselves to support services.
Ability to identify patterns in demographics of students whom advisors don’t meet with
Takeaway:
For the most part, advisors are not easily able to access data about the demographics of students whom they haven’t met with. This is a persistent challenge.
- Yes, I can see that data easily
- Yes, but with some effort
- No, I can't access that data
- I have never tried to disaggregate data
- Don't know
2022
2023
2024
Notes: Survey questions: “Considering the students in your caseload that you are unable to speak with, can you identify patterns in their demographics using resources made available to you (e.g., “What percentage of the students in your caseload that you do not meet with have financial need?”)?”, n = 753
Sources: Driving Toward a Degree 2024, Tyton Partners analysis
Additional Information
Have any questions? Continue the conversation below, learn about how this research was made possible, and dive into the demographics of our Listening to Learners 2024 survey.
Continue the Conversation
Reach out to us and learn how you can get involved in our higher education research.
Sponsors
Learn about how this research was made possible via our sponsors.
Demographics
Learn where our data comes from and what populations we interviewed.
Continue the Conversation
If you would like to speak to us about this work, don’t hesitate to reach out!
We welcome opportunities to share this research at conferences, institutional leadership workshops, and other convenings.
We are proud of our impact on post-secondary education: including institutional case-making, industry media coverage, and durable thought leadership.
Sponsors
Listening to Learners 2024 is funded by the Bill & Melinda Gates Foundation, D2L, and Lumina Foundation.

Our research would not be possible without our survey respondents. Thank you to all the students, instructors, and administrators who so thoughtfully shared their experiences with us to enable learning and improvement.
This site references our other longitudinal studies Time for Class and Driving Toward a Degree. We continue to be grateful for the partnerships we have received from all of our sponsors over the years.
If you are interested in sponsoring our research moving forward, please contact info@tytonpartners.com.
Sponsors 2023 – 2024

Demographics
Listening to Learners 2024 Demographics
For Listening to Learners 2024, 1,600 students from two—and four-year private and public institutions were surveyed. Student respondents represent a range of demographic backgrounds.
Listening to Learners 2024 student survey respondents (1/2)
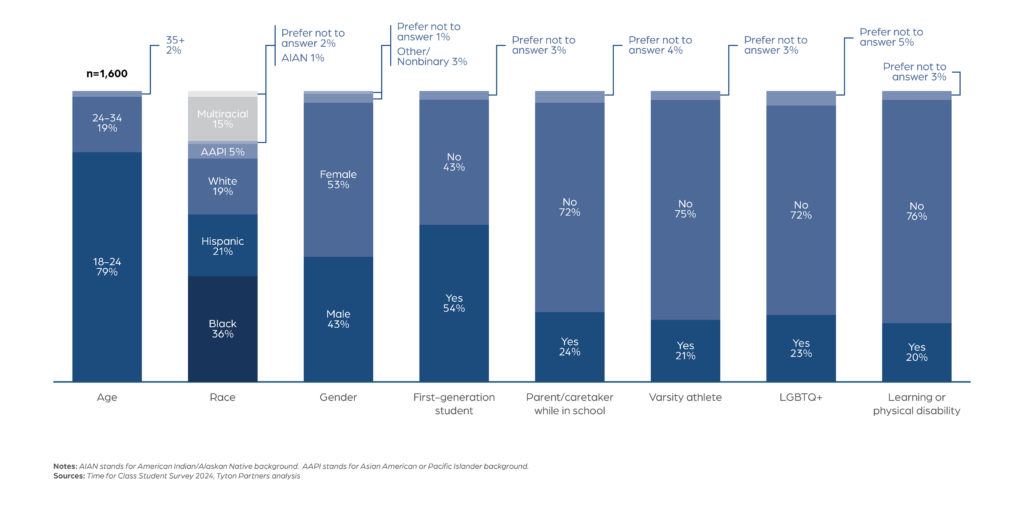
The Listening to Learner respondent pool focused on students whose experiences are of particular importance to understand (e.g., stopped-out students) as we unpack the evolving nature of digital teaching and learning.
Listening to Learners 2024 student survey respondents (2/2)
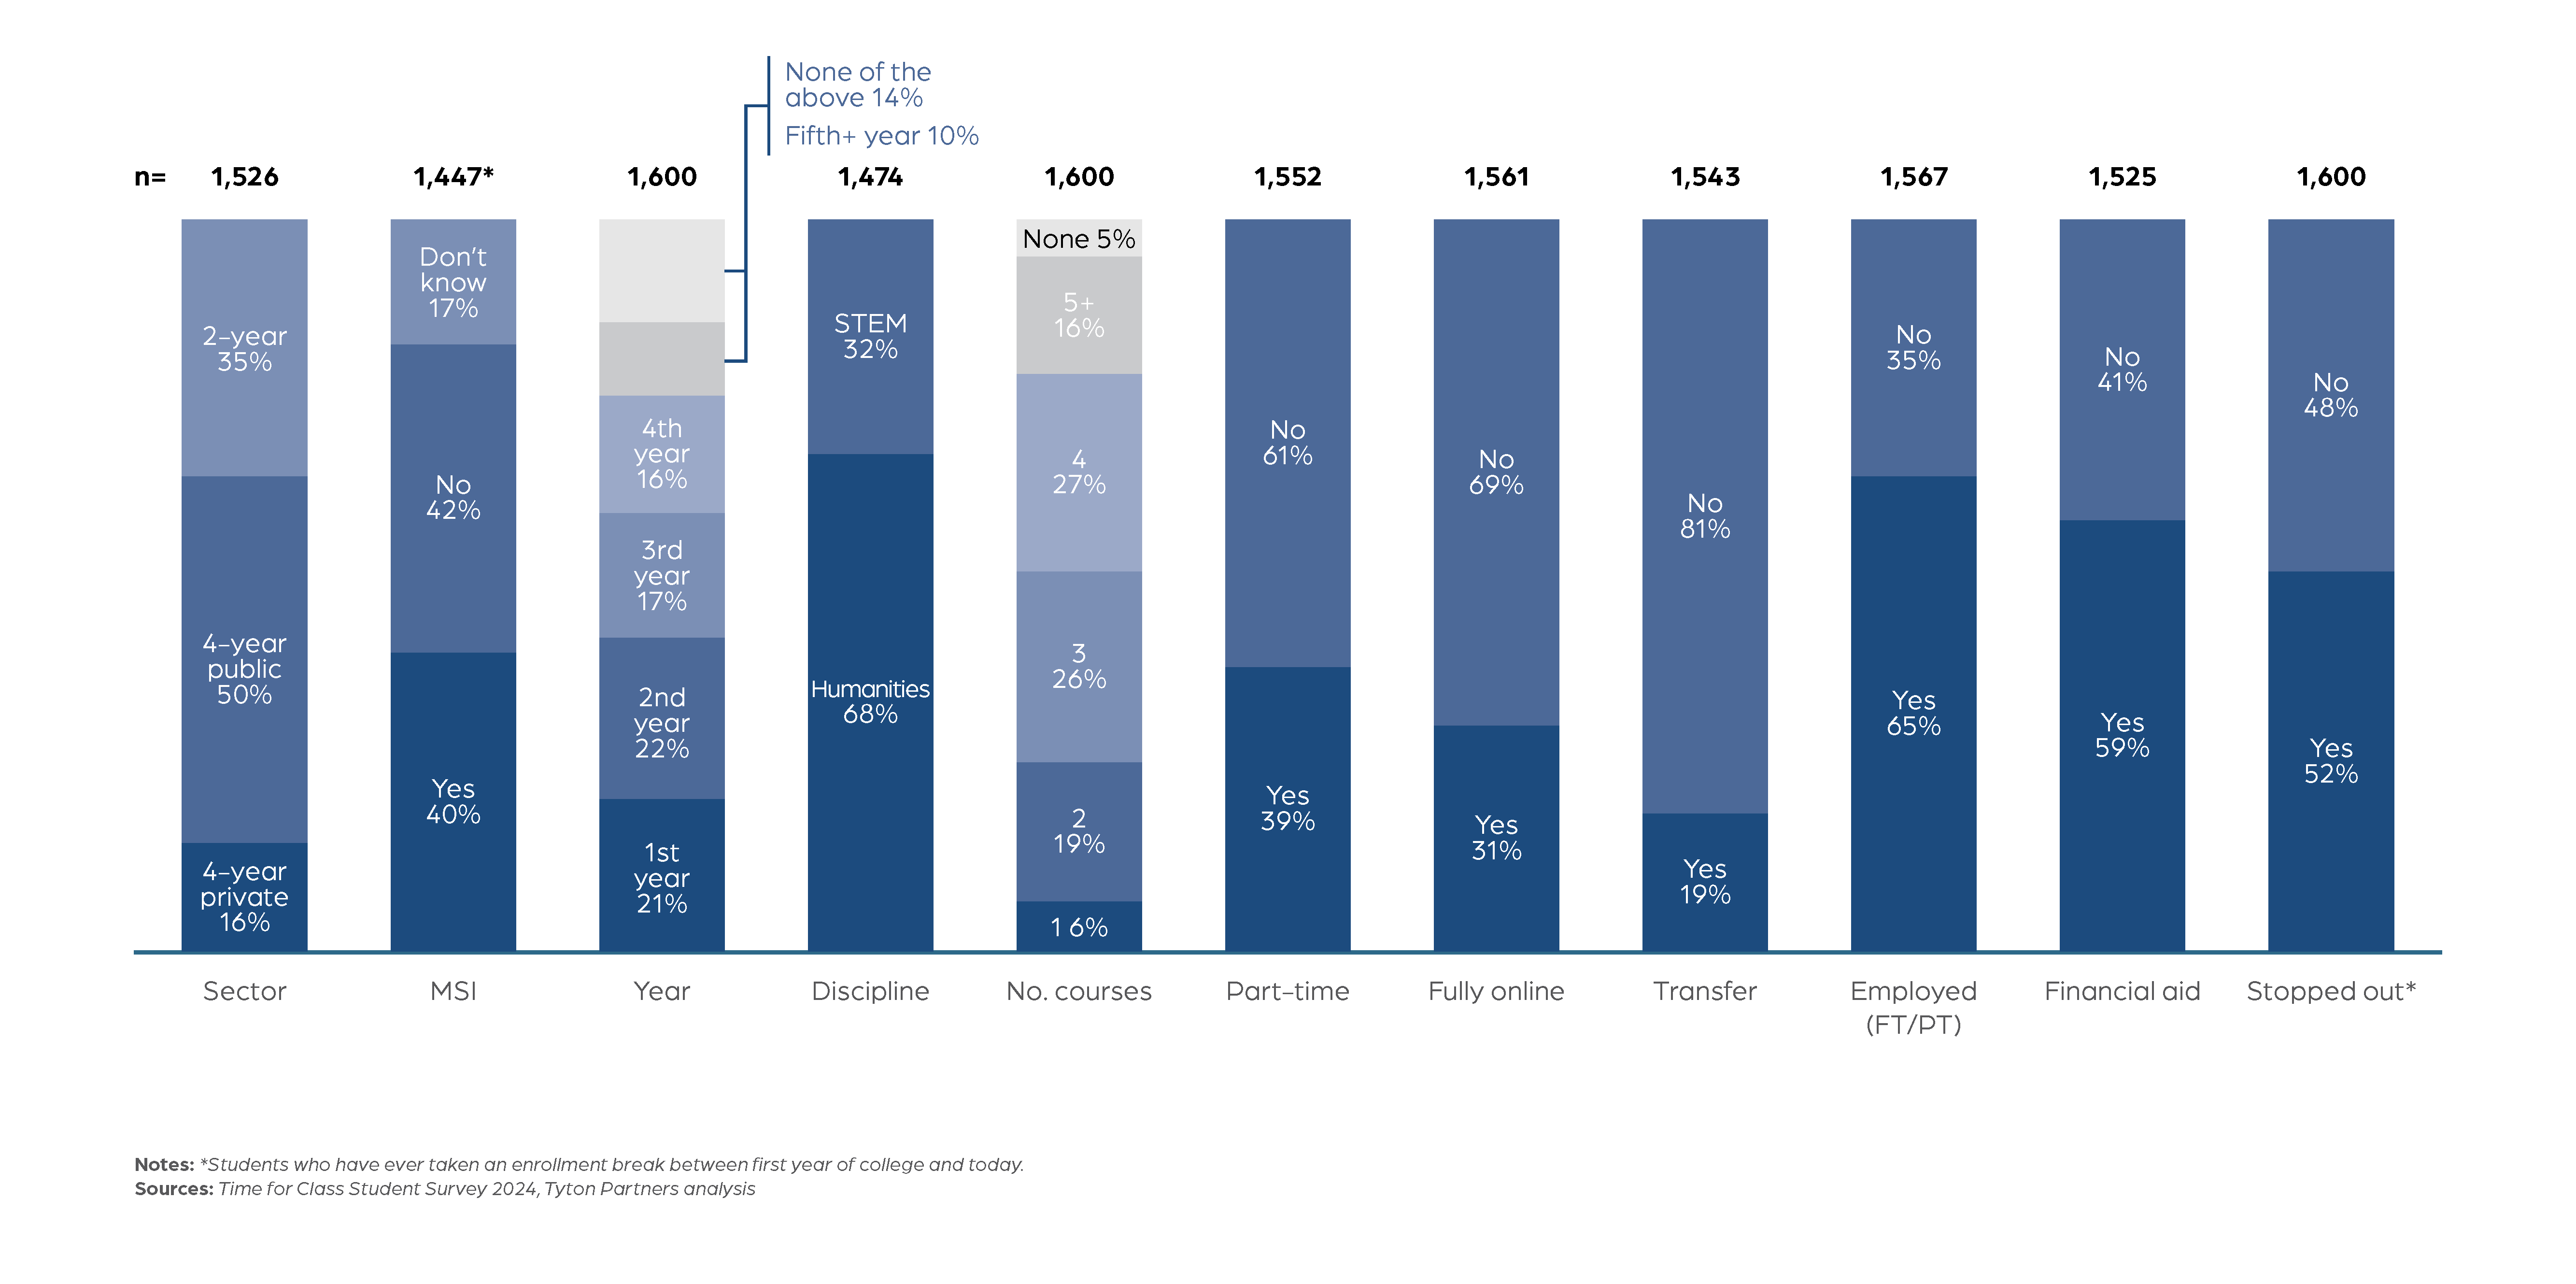
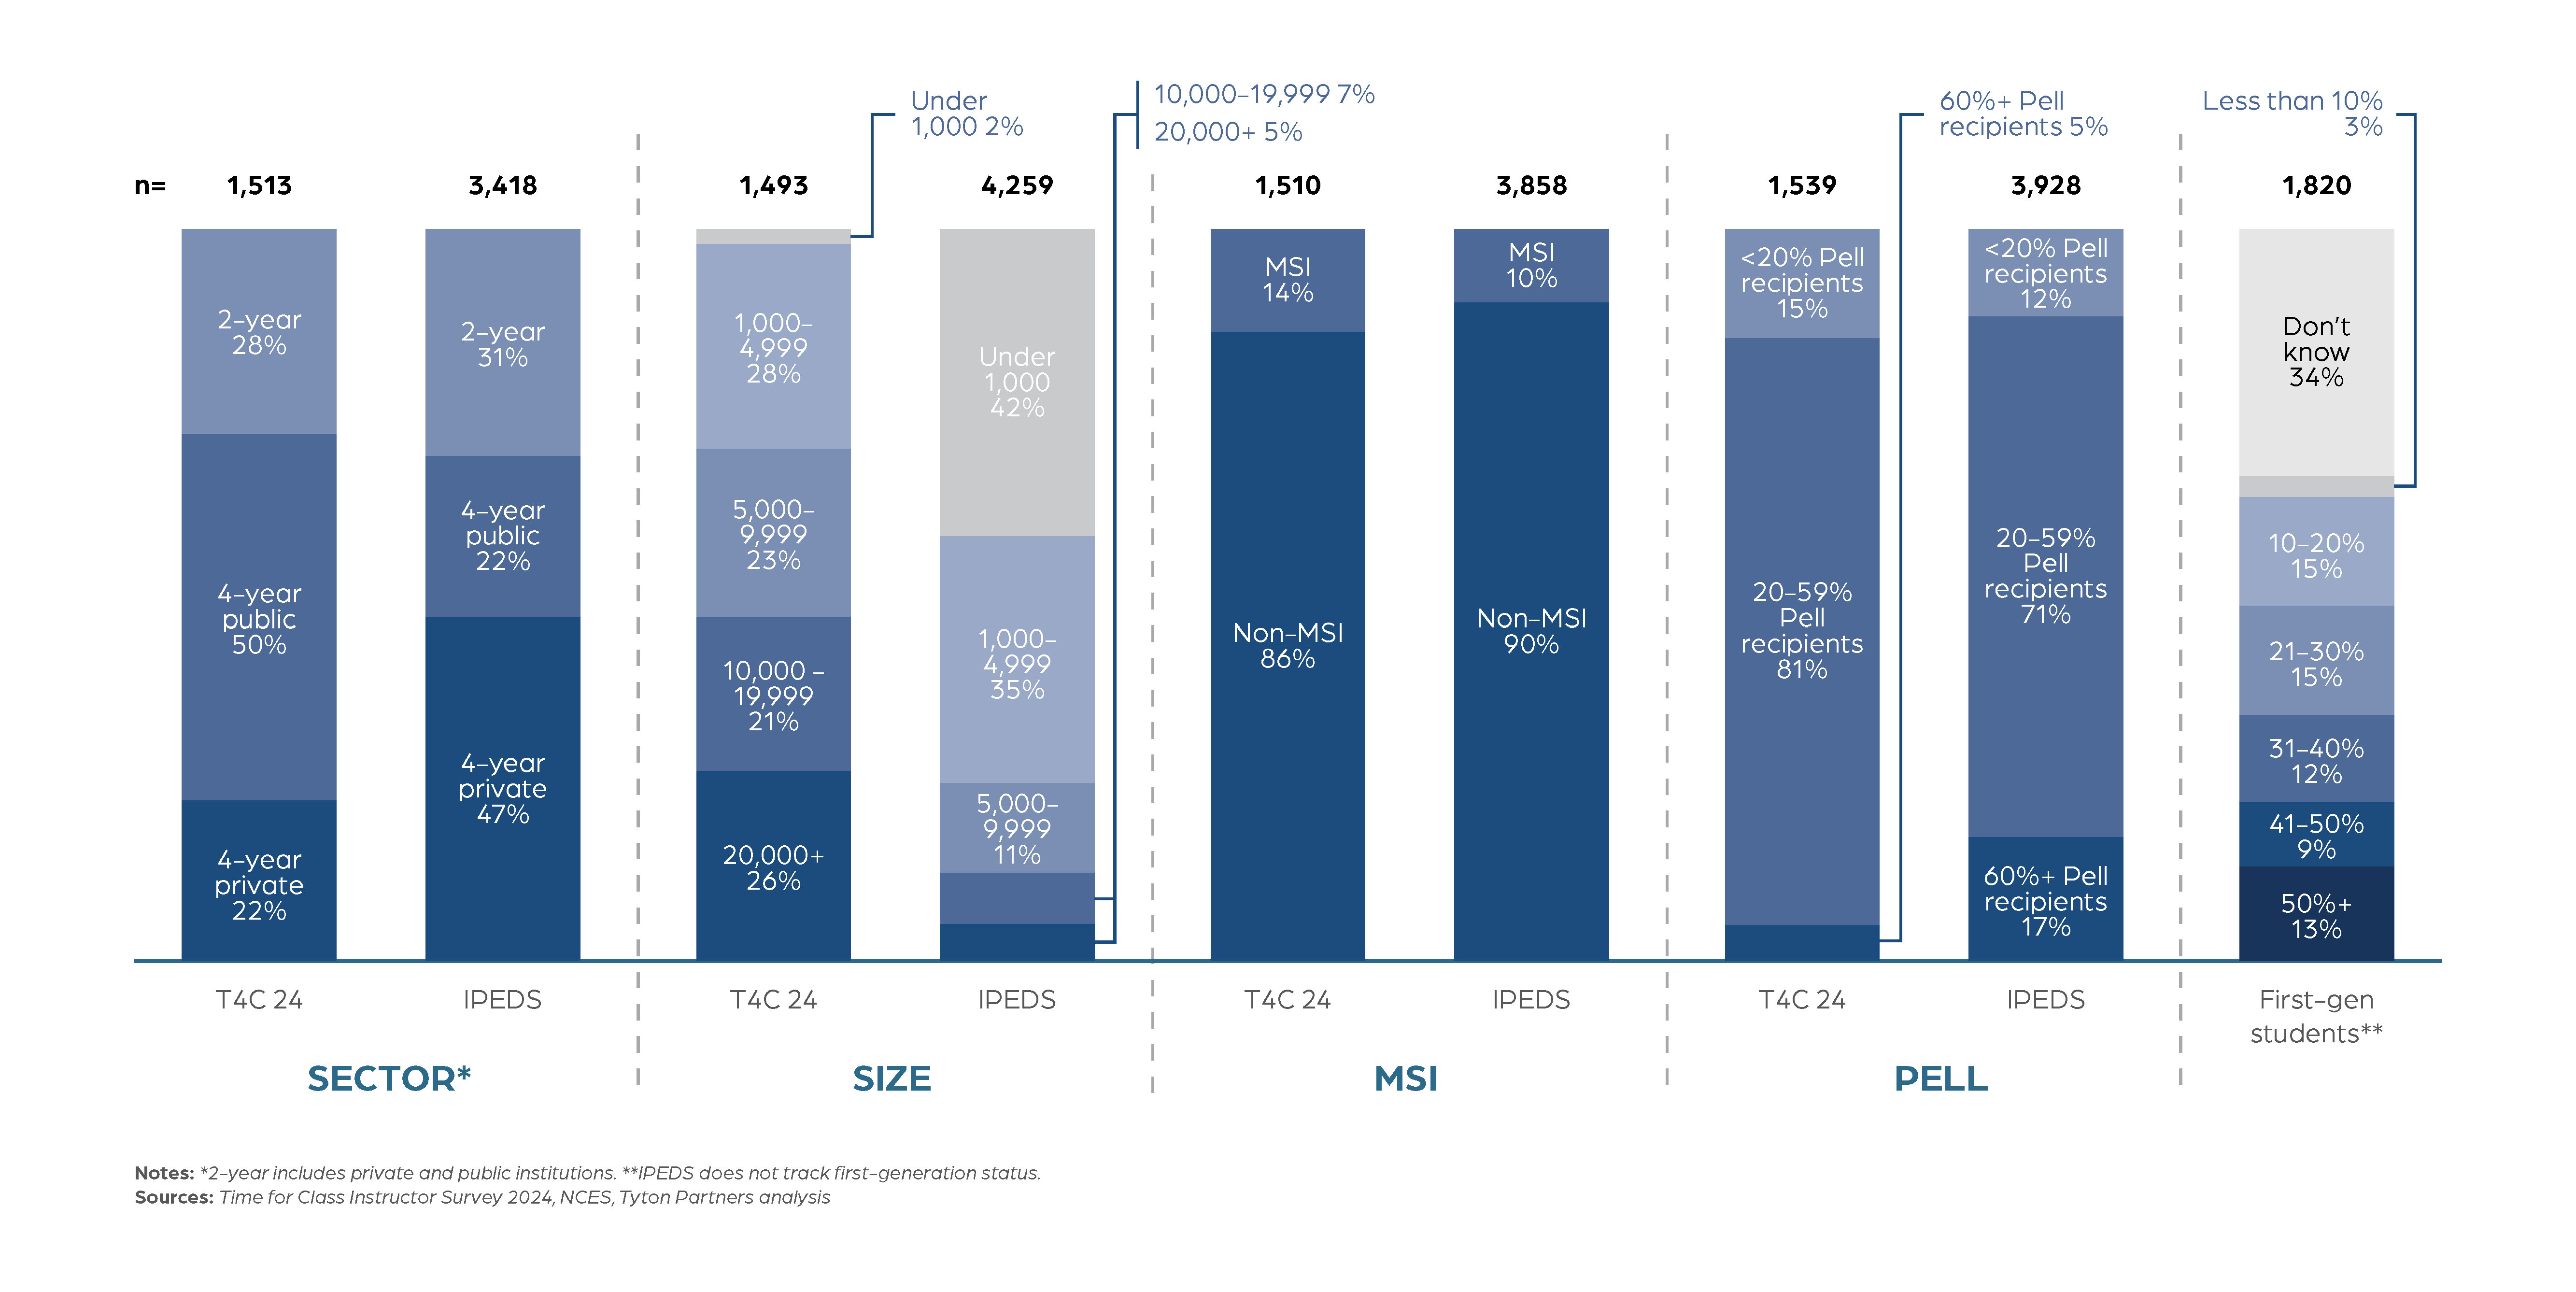
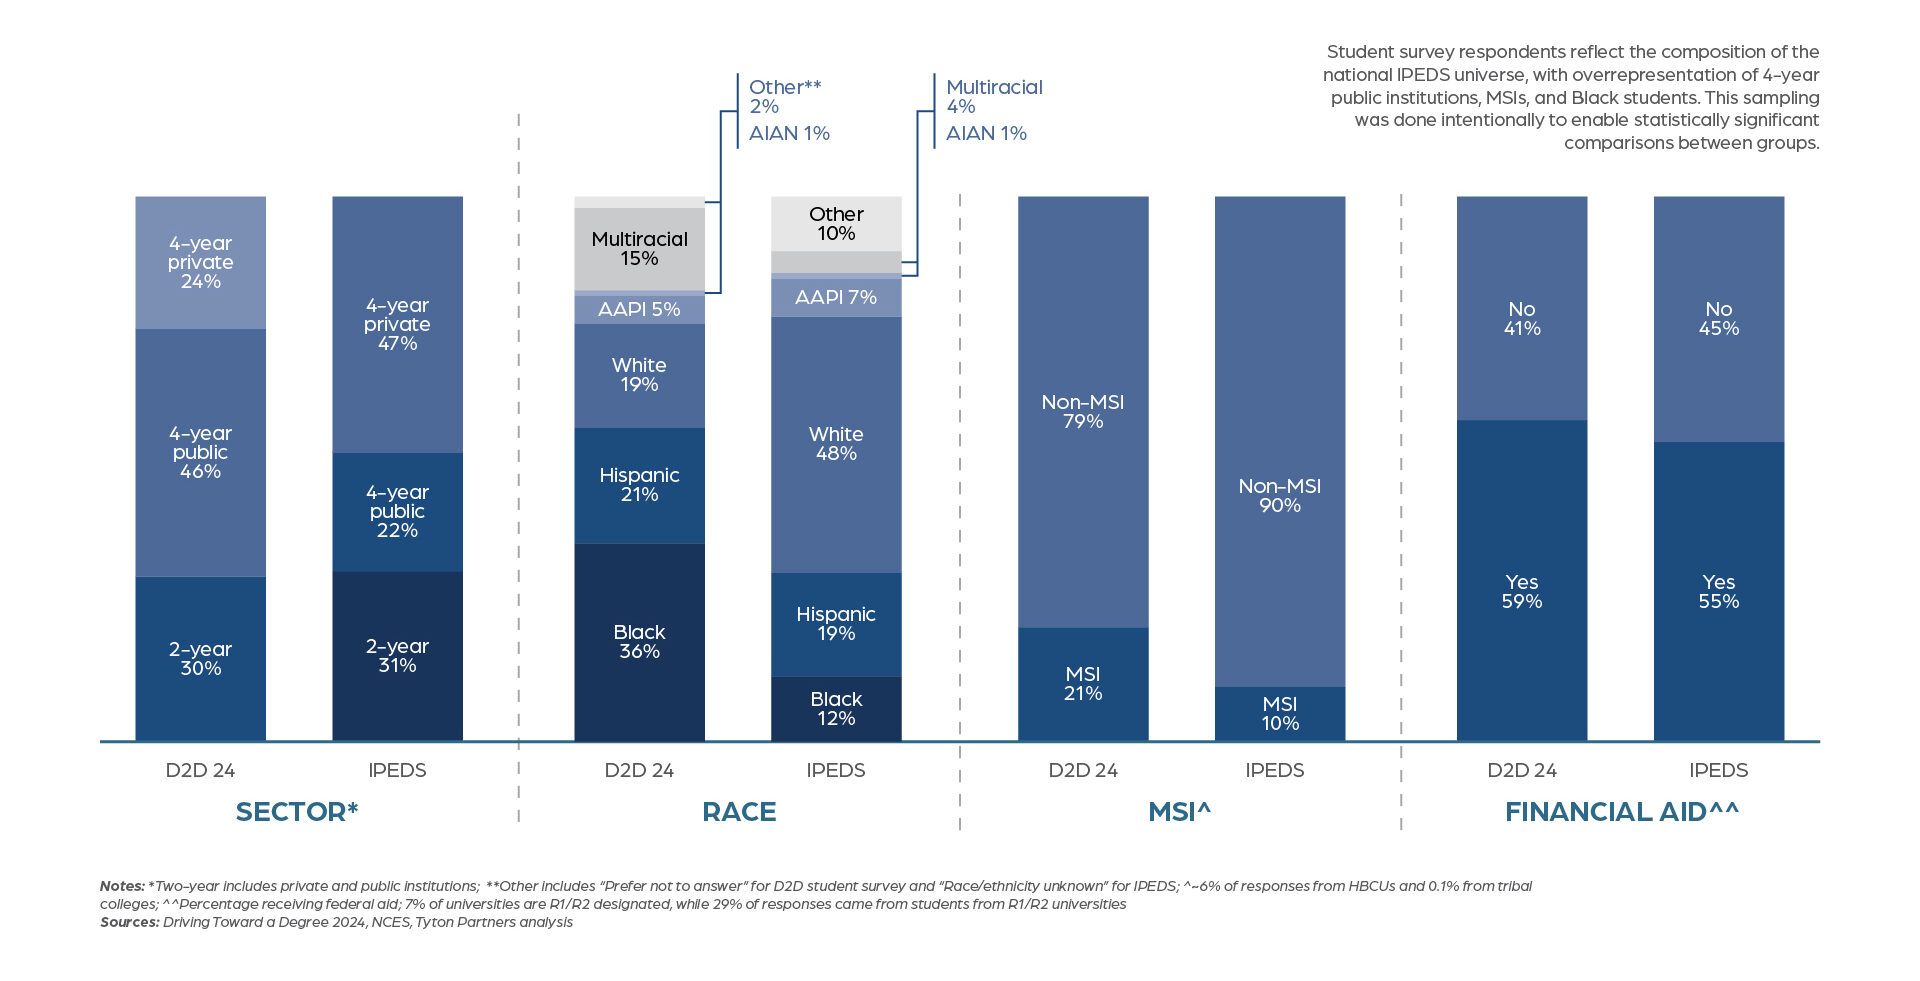
Student survey respondents reflect the composition of the national IPEDS universe, with an overrepresentation of 4-year public institutions, MSIs, and Black students. This sampling was done intentionally to enable statistically significant comparisons between groups.
Comparison of student populations and IPEDS distribution
Time for Class and Driving Toward a Degree 2024 Demographics
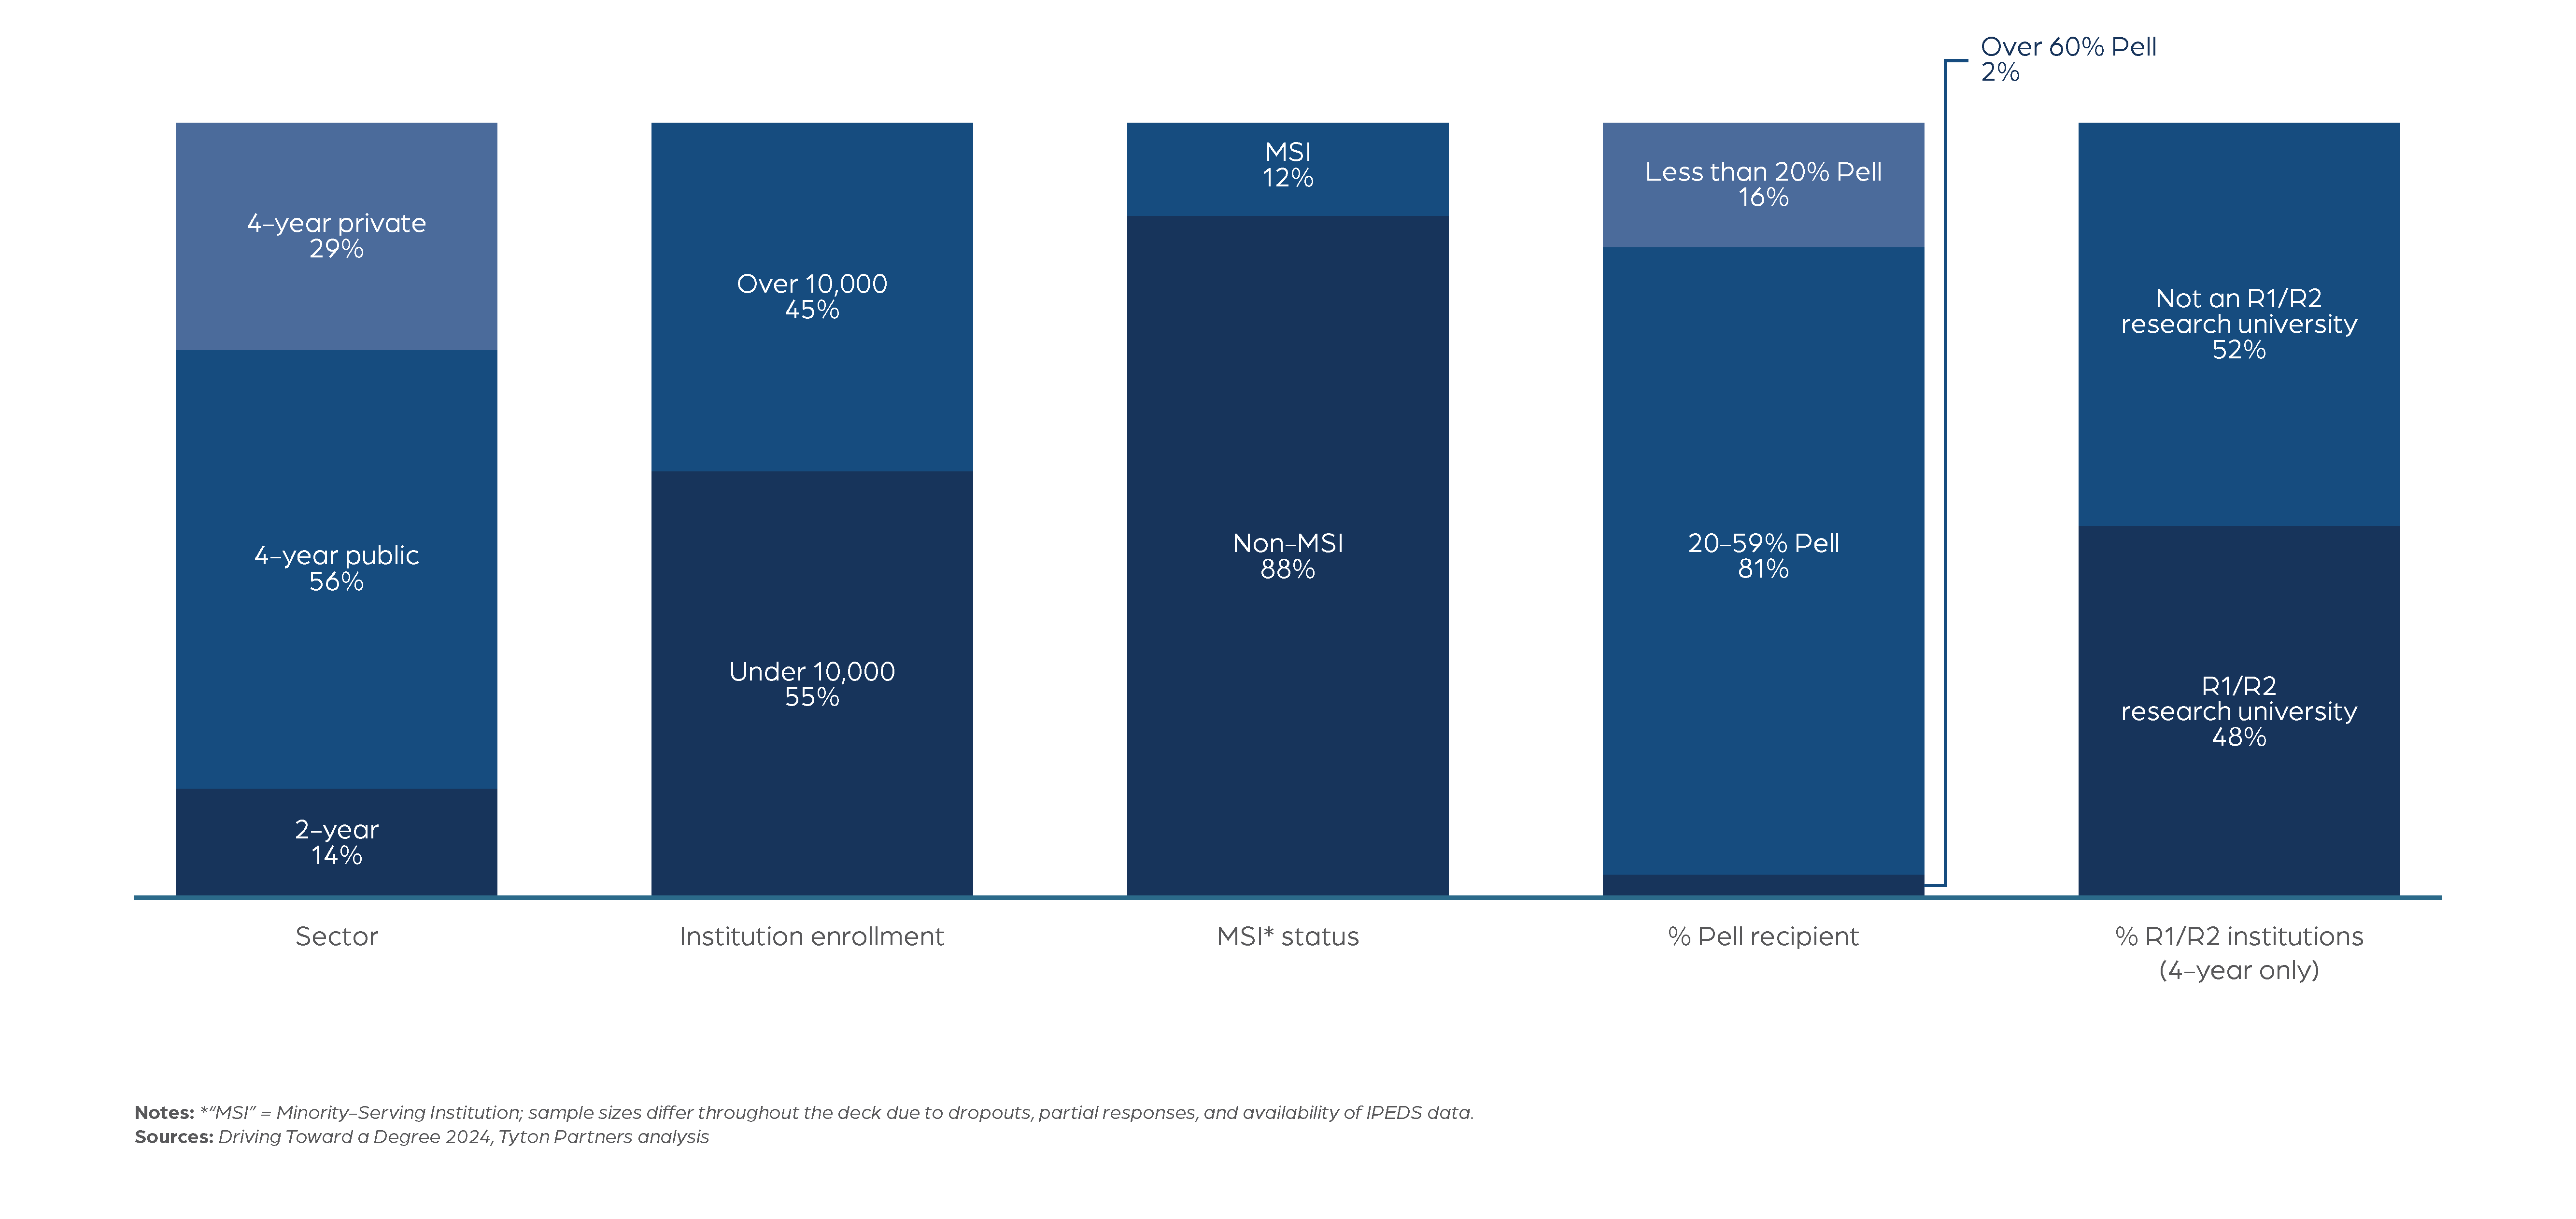
Driving Toward a Degree 2024’s institutional survey received over 1,500 responses, representing a broad range of institutions…
Overview of institutional survey respondents (1 of 3)
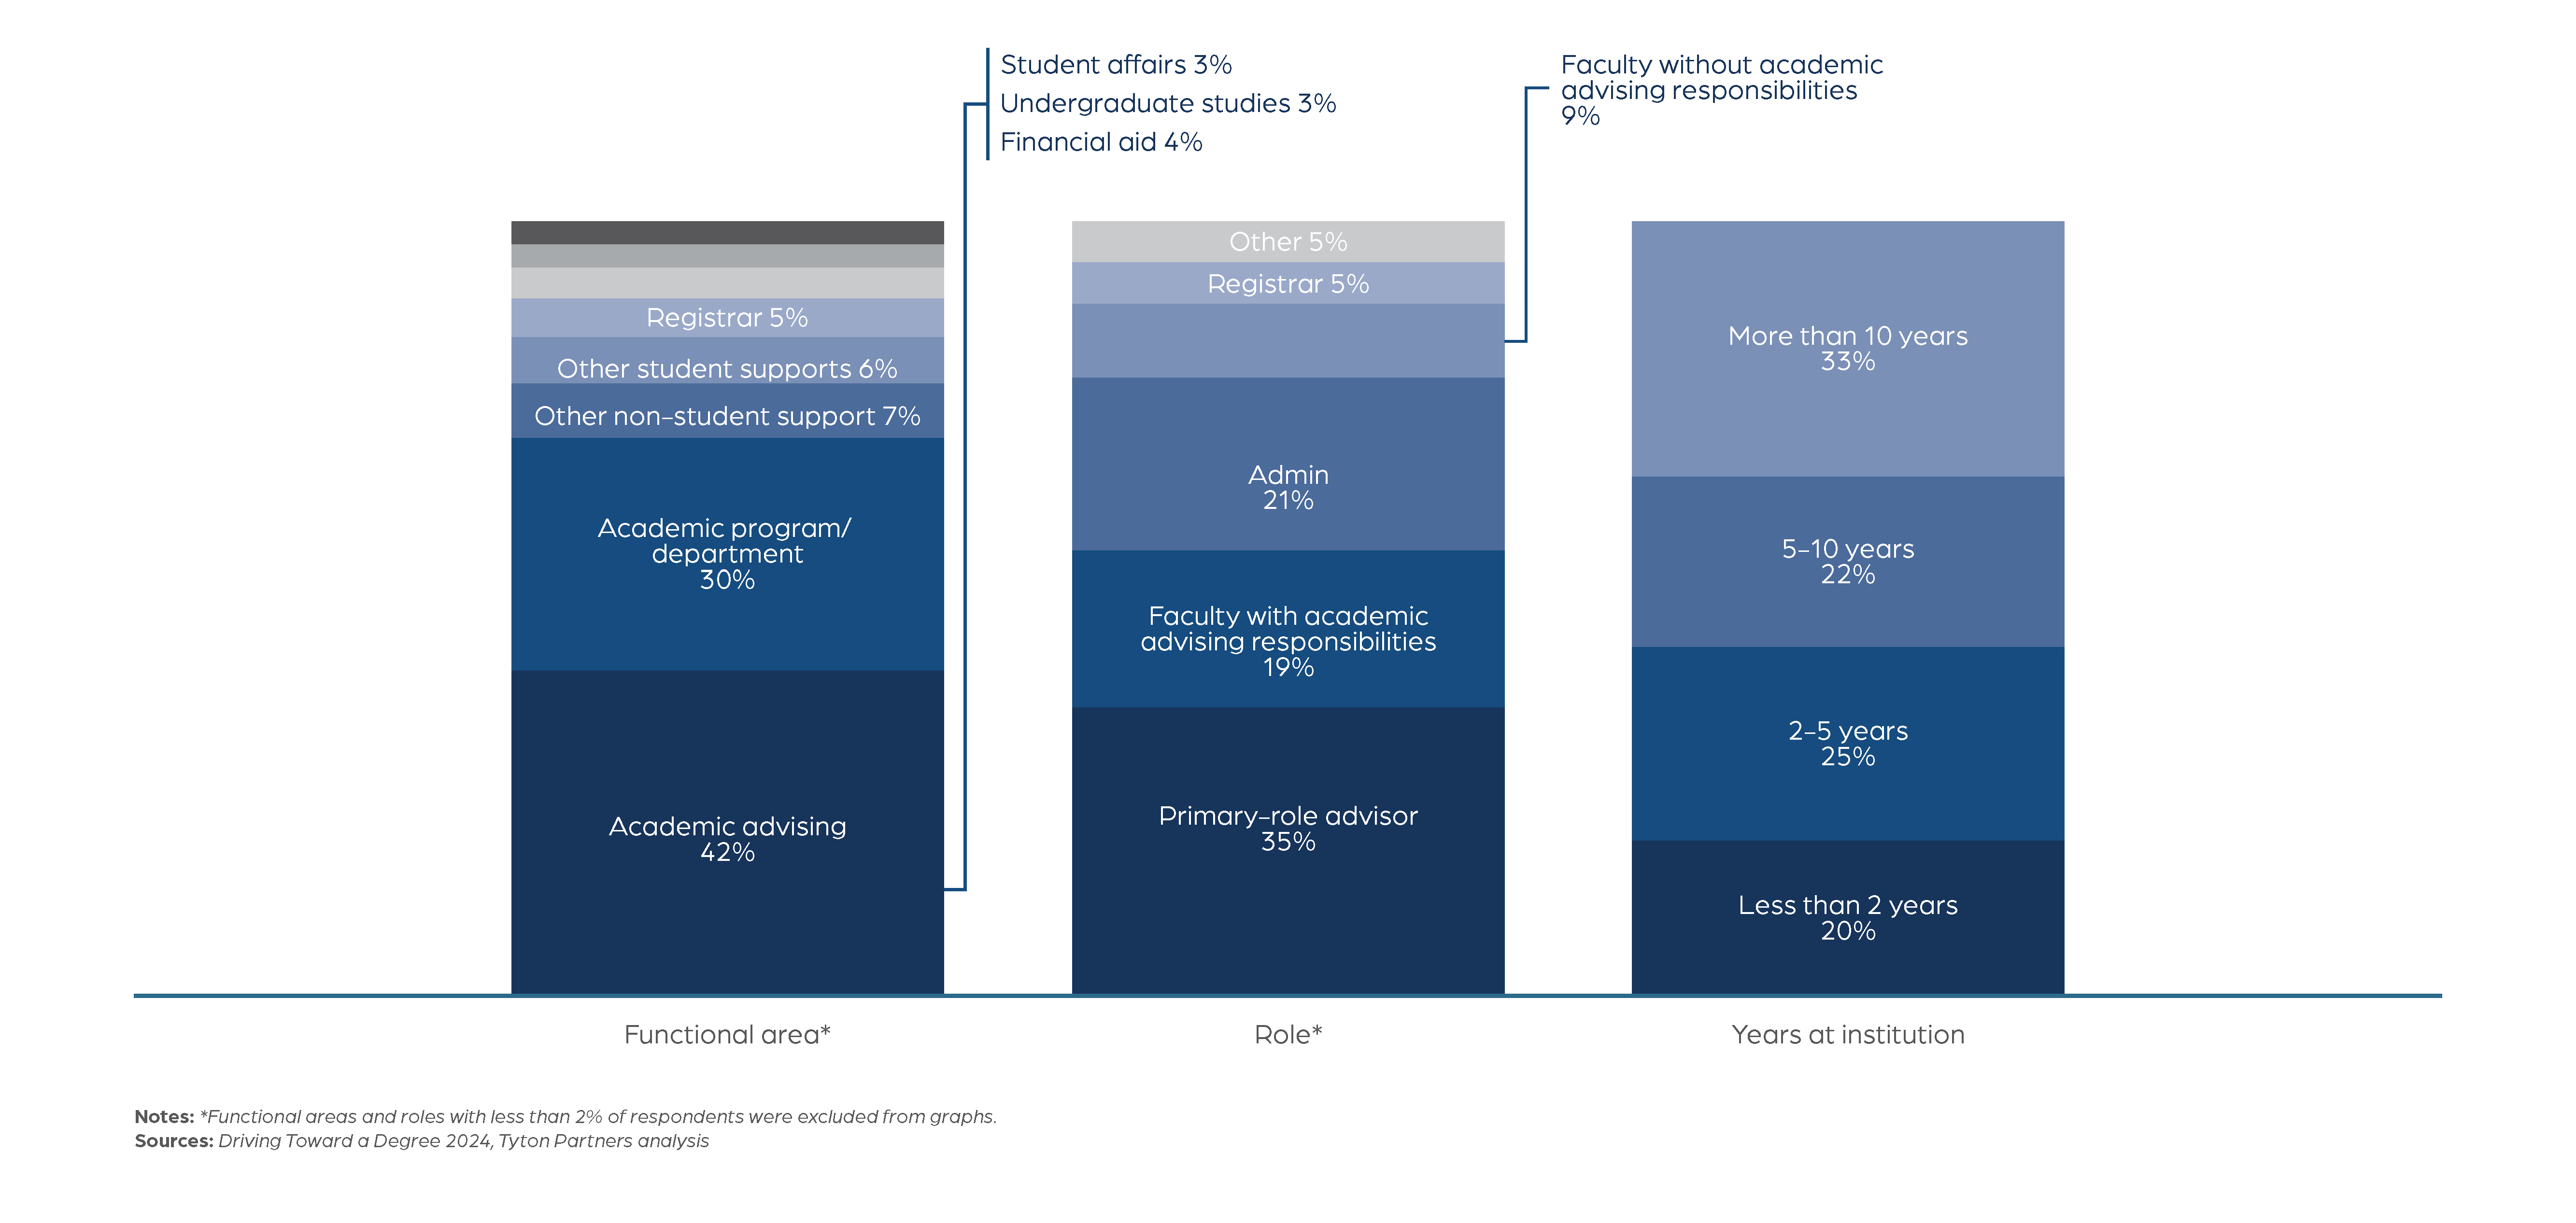
…as well as diversity in functional area, role, and years of experience; similar to past years, academic advisors intentionally comprise a large portion of the sample.
Overview of institutional survey respondents (2 of 3)
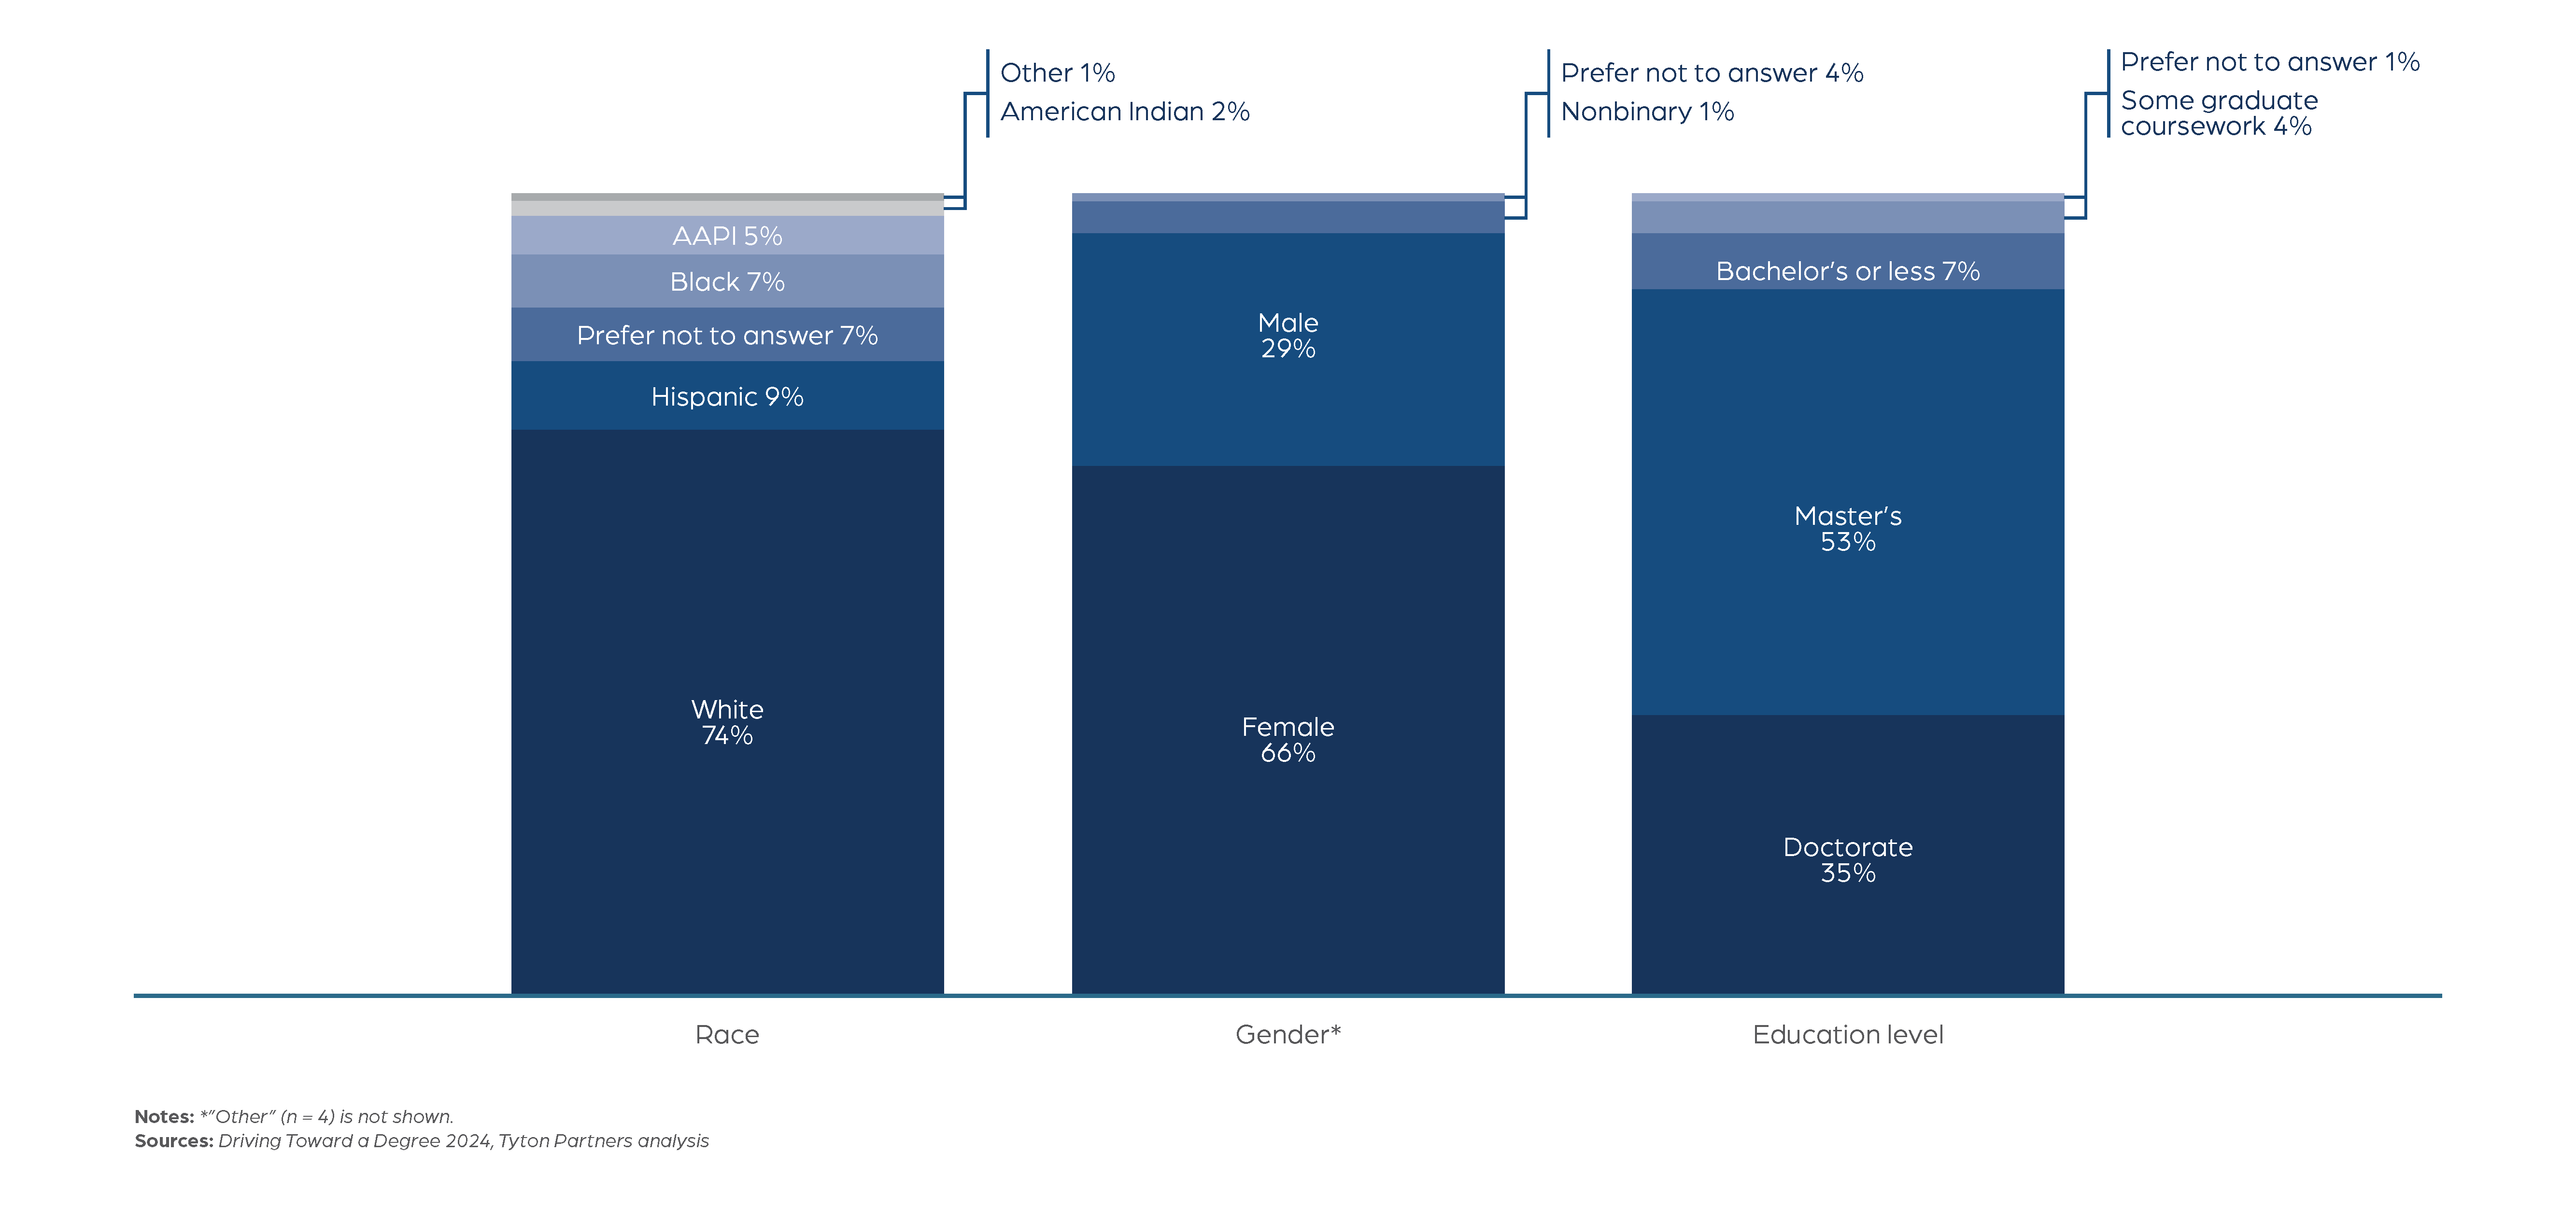
Institutional survey respondents are mostly white and female, with a range of education levels.
Overview of institutional survey respondents (3 of 3)
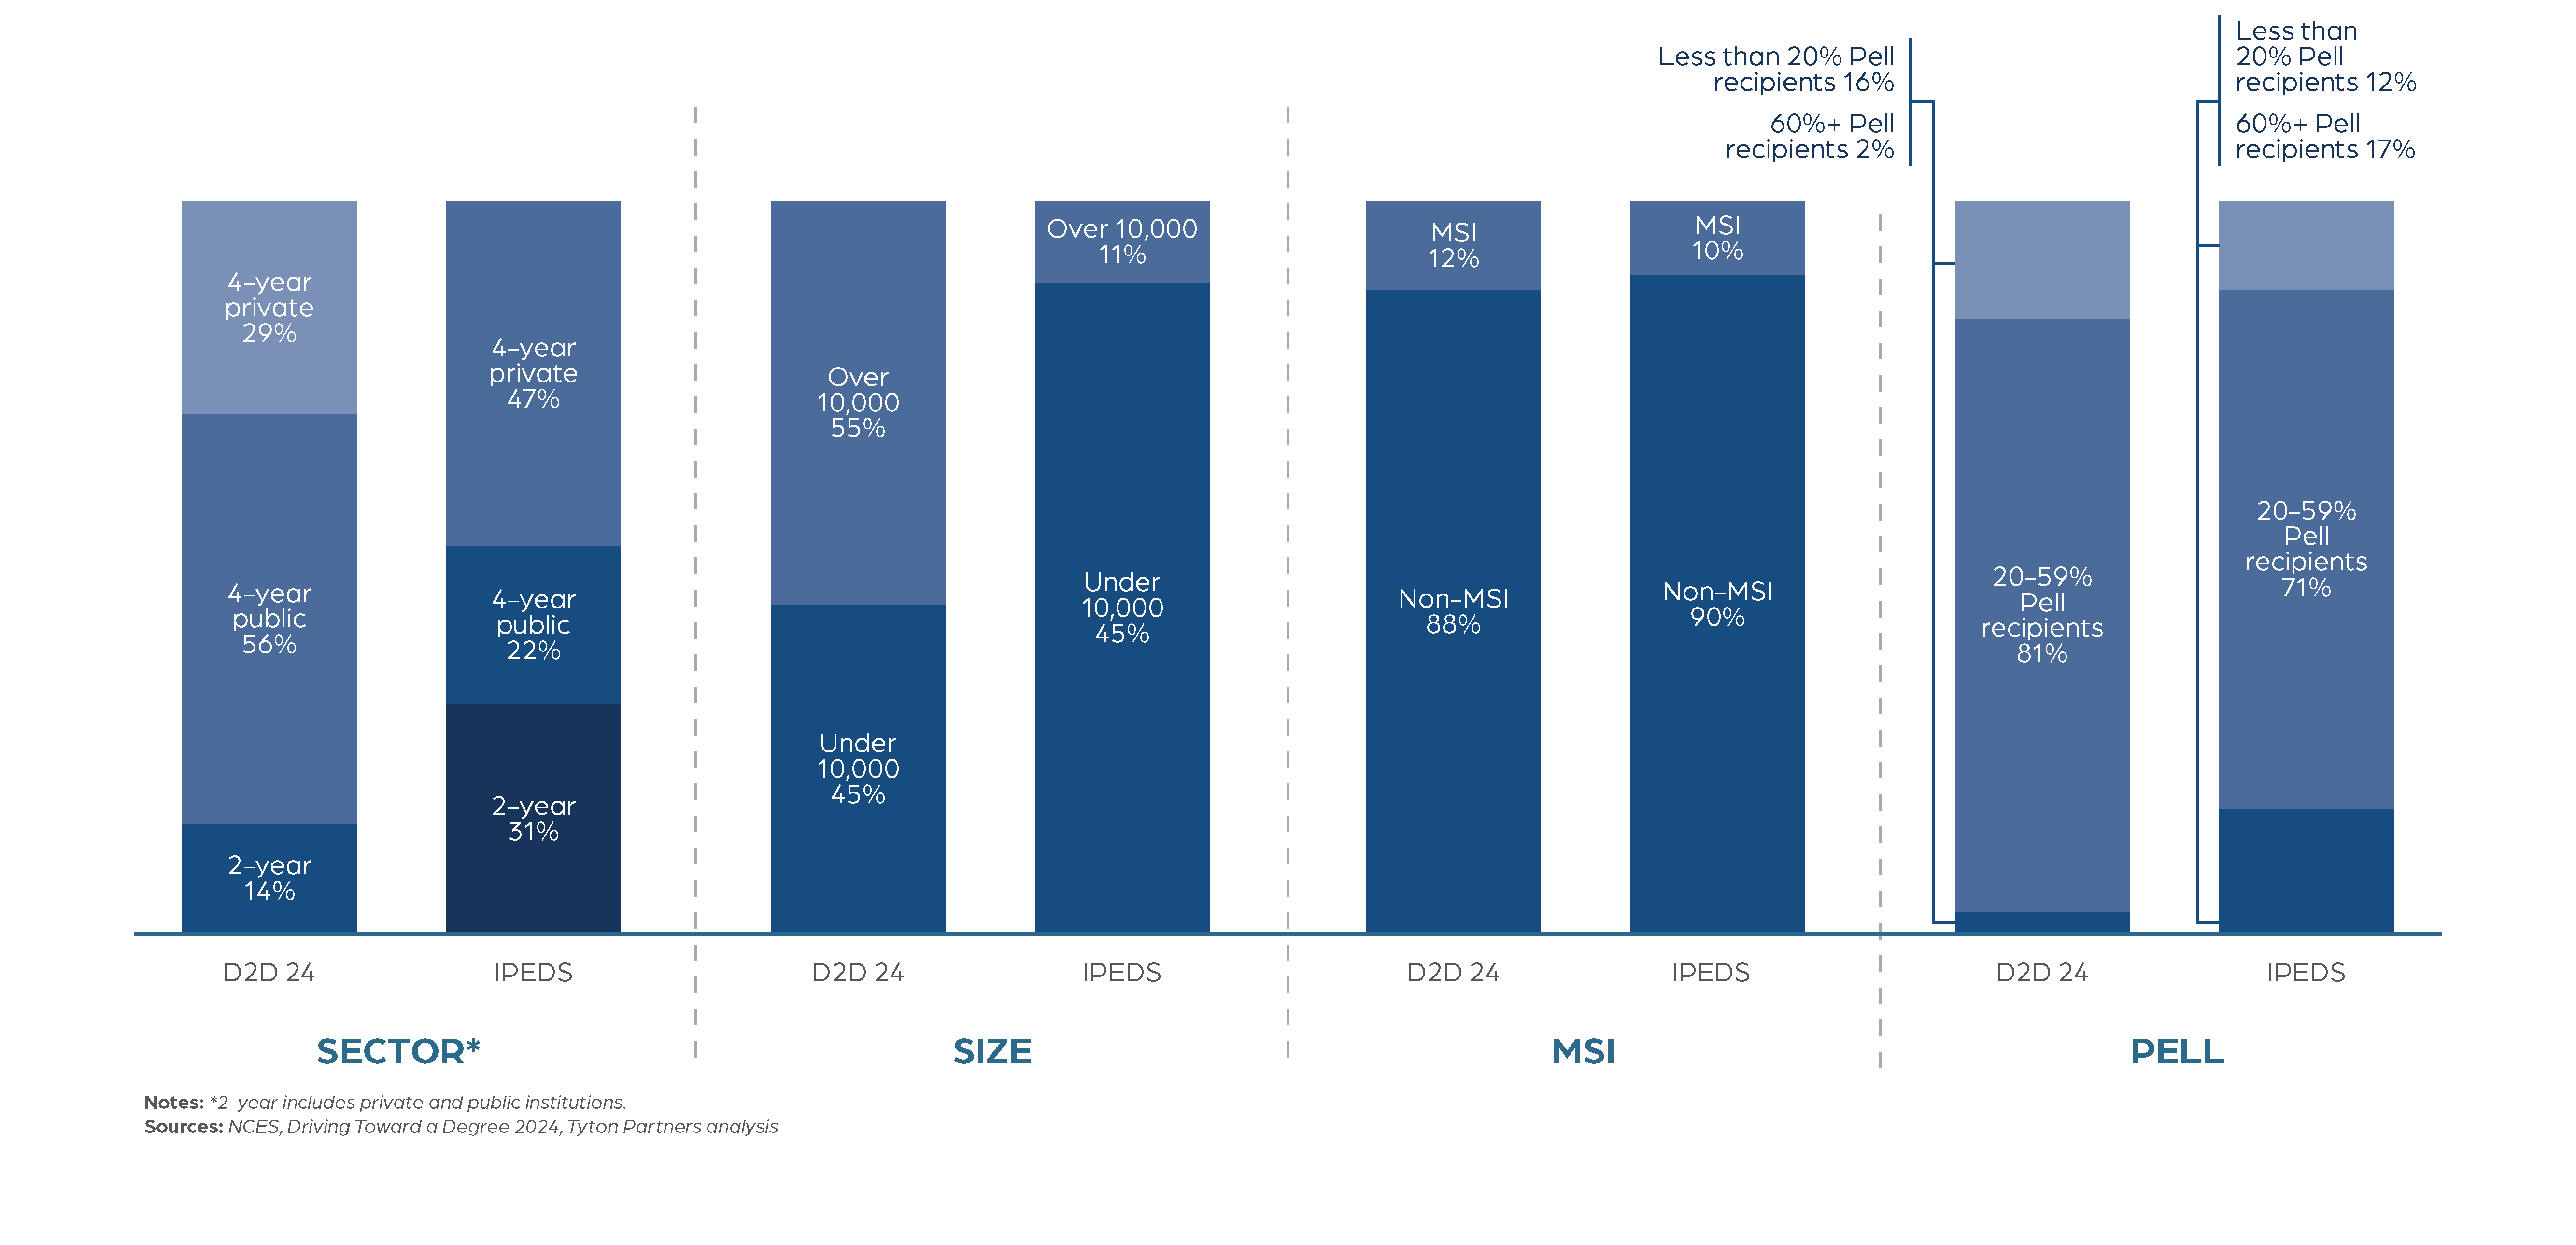
Institutional survey respondents generally reflect the composition of the national IPEDS universe; 4-year public institutions are overrepresented.
Comparison of institutional respondents and IPEDS distribution
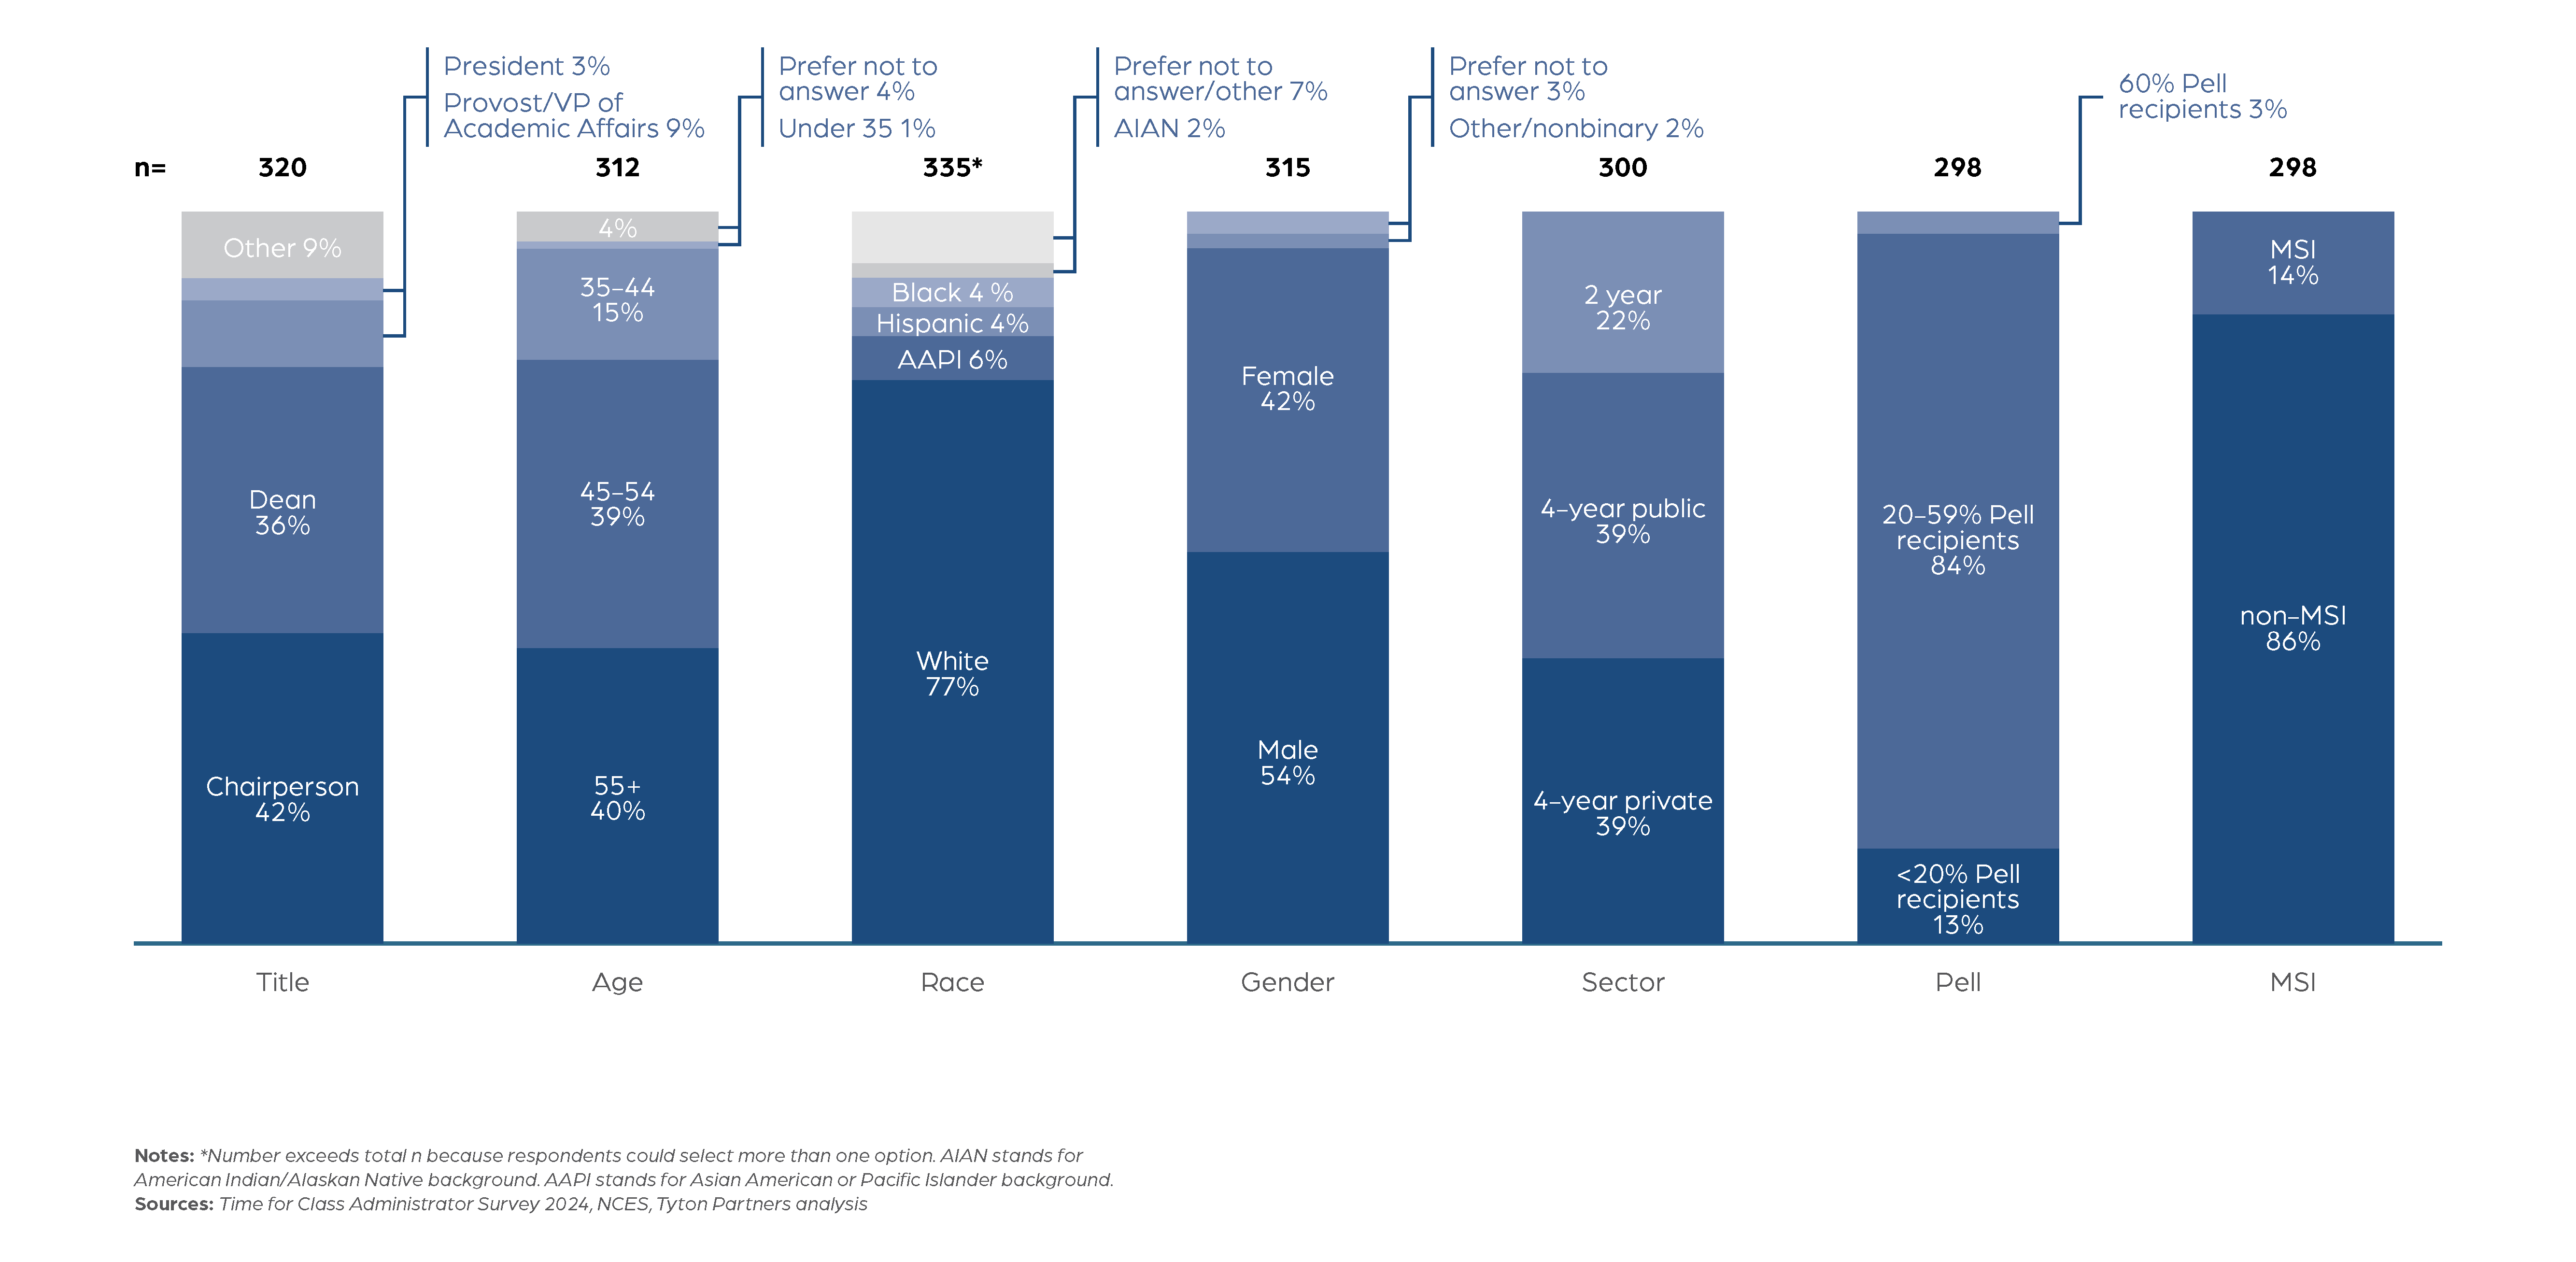
Approximately 300 administrators responded to Time for Class 2024, representing 274 unique institutions.
Time for Class 2024 administrator survey respondents
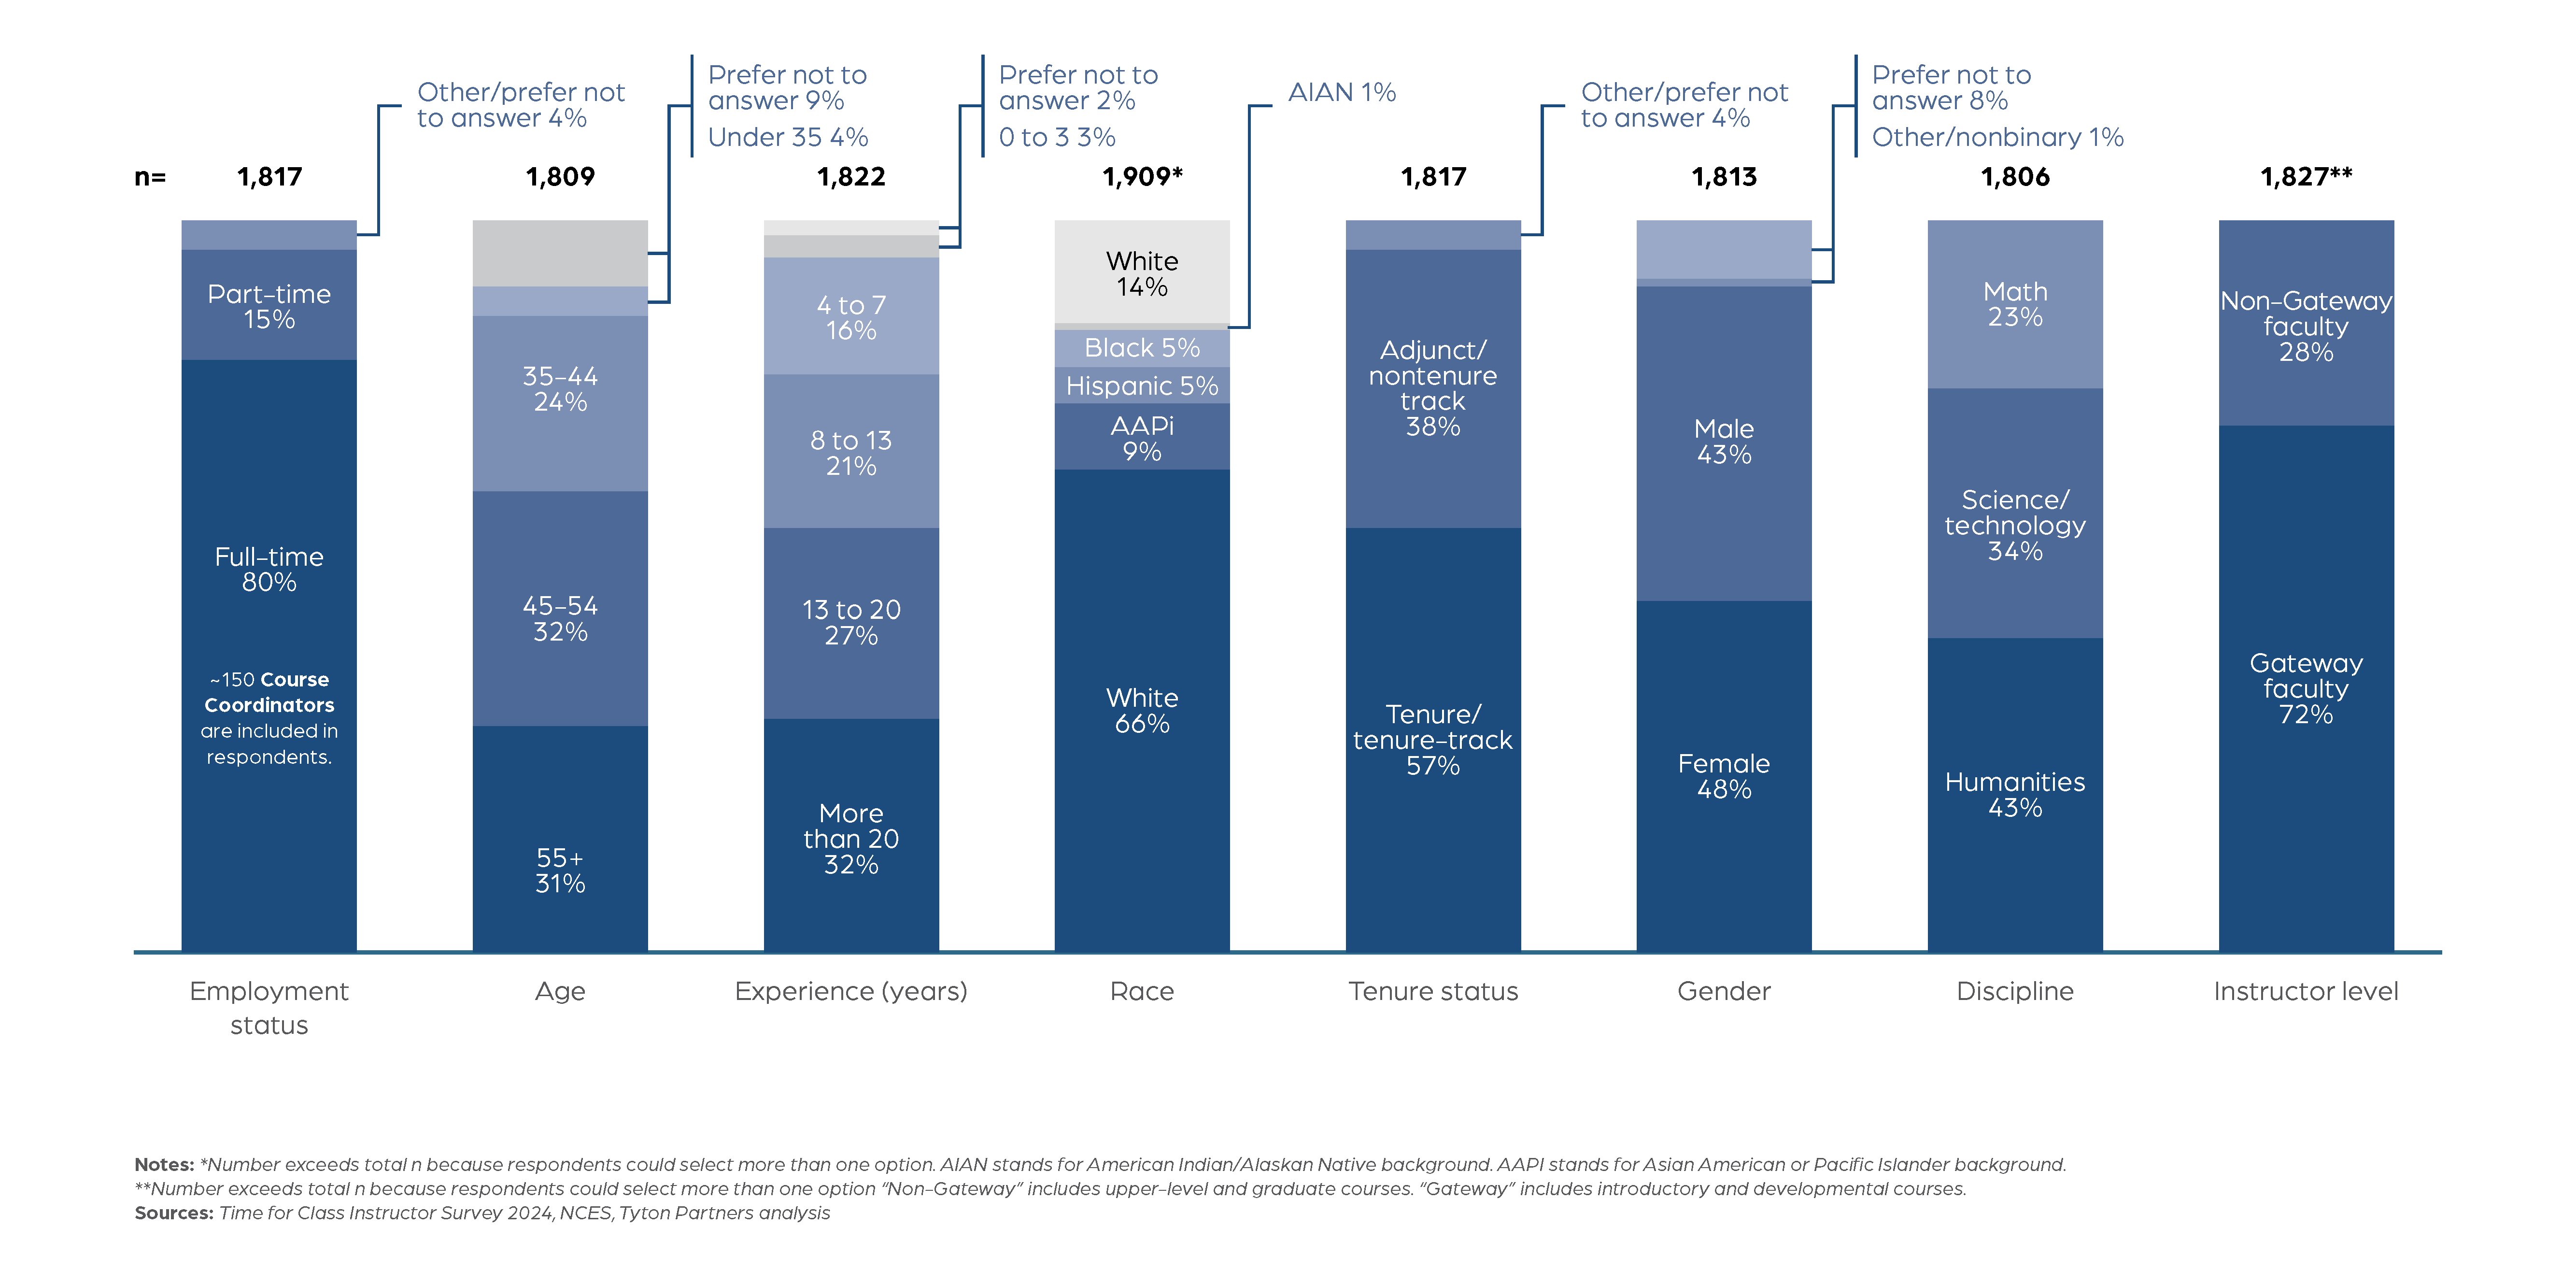
Approximately 1,800 instructors responded to Time for Class 2024, representing over 860 unique institutions.
Time for Class 2024 instructor survey respondents
Institutions in the instructor survey reflect the composition of the national IPEDS universe, 4-year public institutions are overrepresented.
Comparison of Time for Class 2024 instructor institutions and IPEDS distribution
