Listening to Learners
ABCs of Persistence: Awareness of Services, Belonging, and Career Readiness
Introduction
Listening to Learners 2025 links student perspectives on learning and support to institution-level practices and technologies. Connecting institutional and student perspectives enables stakeholders and partners to explore their impact on student success, access and equity, and overall institutional satisfaction.
Listening to Learners is one of three research publications that Tyton Partners runs annually to measure market trends in supporting student success in and outside of the classroom. You can learn more about Time for Class and Driving Toward a Degree at your leisure.

Belonging
Student belonging is a key driver of self-reported likelihood to persist and institutional ROI

Learner Awareness
Low awareness of and engagement with student support services limits their impact

Career Readiness
Career readiness is a key component of the value of higher education for students; offering non-degree credentials is one important way of supporting it.

GenAI Use
Institutional stakeholders must match students' familiarity with genAI tools to better enhance learning and retention outcomes

Dual Enrollment
Dual enrollment fuels college-going momentum but more intentional investments are needed to support transition

Equity-Excellence Imperative
Excellence without equity does not serve our institutions or the future workforce
Belonging
Belonging is a measurable driver of persistence, not just a feel-good outcome:
Students who feel like they belong are more likely to self-indicate that they will stay enrolled. While student perception of an advisor’s ability to provide personalized advice is limited, deeper student-advisor relationships support both belonging and self-indicated likelihood to persist.
Using technology to help cut through time spent in sessions discussing topics less personally important topics to students, co-locating support services, and ensuring students feel physically and emotionally safe on campus can increase feelings of belonging.
Students who feel a strong sense of belonging at their institution are far more likely to say they will re-enroll.
For first-year students, likelihood of re-enrollment is even more strongly correlated with feelings of belonging at their school (r(505)=.32, p<.001). This emphasizes the need for institutions to build belonging early in the student journey.
For international students, belonging is especially critical to re-enrollment decisions: those who strongly feel they belong at their school are +33pp more likely to say they are extremely likely to re-enroll next year as compared to those who only somewhat feel they belong.
The relationship between belonging and likelihood of re-enrollment persists for first-generation students.
Student self-reported likelihood of re-enrollment by student sense of belonging*
- Not at all likley to re-enroll
- Neutral
- Extremely likely to re-enroll
I don’t feel like I belong at my school
Somewhat don’t belong
Neutral
Somewhat belong
I feel like I belong at my school
- Not at all likley to re-enroll
- Neutral
- Extremely likely to re-enroll
I don’t feel like I belong at my school
Somewhat don’t belong
Neutral
Somewhat belong
I feel like I belong at my school
- Not at all likley to re-enroll
- Neutral
- Extremely likely to re-enroll
I don’t feel like I belong at my school
Somewhat don’t belong
Neutral
Somewhat belong
I feel like I belong at my school
- Not at all likley to re-enroll
- Neutral
- Extremely likely to re-enroll
I don’t feel like I belong at my school
Somewhat don’t belong
Neutral
Somewhat belong
I feel like I belong at my school
Note: *Survey question: “How likely are you to stay enrolled at your college/university next term?” segmented by ”To what extent do you agree or disagree with the following statements? I feel like I belong at my school.”, total first generation n = 649, “I don’t feel like I belong at my school” n = 37, “Somewhat don’t belong” n = 46, “Neutral” n = 146, “Somewhat belong” n = 159, “I feel like I belong at my school” n = 261
Sources: Listening to Learners 2025, Tyton Partners analysis
Students’ perception of advisor ability to provide personalized guidance remains limited: only 21% of first-year students feel their advisor knows them well enough toprovide personalized guidance. Though this does increase by student tenure, it reinforces a greater need for early supports.
Students
Advisors’ knowledge about student context*, by tenure**
- Advisor does not know my life experiences well enough to provide personalized advice
- Neutral
- Advisor knows my life experiences well enough to provide personalized advice
First year
Second year
Third year
Fourth year
Fifth+ year
Notes: *Survey question: “Please indicate your level of agreement with the below statement. My academic advisor knows enough about my life experiences (e.g., race/ethnicity, first-generation student, veteran status) to provide personalized advice and options.”; **Survey question: “What year are you in school?”, n = 1,529; ^Survey question: “Please choose the phrase that best describes your level of agreement with the following statements. First year students can select their own classes each term without help from an academic advisor.”, n = 932
Sources: Listening to Learners 2025, Tyton Partners analysis
Building deeper student-advisor connections can bring meaningful impact. Students who feel they belong at their institution are more likely to indicate that their advisor is able to provide personalized guidance (+22pp over those unlikely or neutral), as are students who self-indicate that they are likely to persist (+23pp over those unlikely or neutral).
Advisors’ knowledge about student context*
By sense of belonging**
Don't feel like I belong
Neutral
Feel like I belong
- Advisor does not know my life experiences well enough to provide personalized advice
- Neutral
- Advisor knows my life experiences well enough to provide personalized advice
Advisors’ knowledge about student context*
By self-reported likelihood to persist^
Not likely to persist
Neutral
Likely to persist
- Advisor does not know my life experiences well enough to provide personalized advice
- Neutral
- Advisor knows my life experiences well enough to provide personalized advice
Notes: *Survey question: “Please indicate your level of agreement with the below statement. My academic advisor knows enough about my life experiences (e.g., race/ethnicity, first-generation student, veteran status) to provide personalized advice and options.”; **Survey question: ”To what extent do you agree or disagree with the following statements? I feel like I belong at my school.”, “Don’t feel like I belong” n = 133, “Neutral” n = 312, “Feel like I belong” n = 851; ^Survey question: “To what extent do you agree or disagree with the following statements? I feel like I belong at my school.”, “Not likely” n = 66, “Neutral” n = 259, “Likely to persist” n = 921
Sources: Listening to Learners 2025, Tyton Partners analysis
Students are four times more likely than advisors to want to discuss non-degree credentials and campus safety, subjects that exceed the scope of what is typically possible in a single advising meeting. With available advisor time as a limitation and course-related topics as a “must-do” for advisors, enhanced delivery of student self-service degree audit, pathway visualization, and chatbot tools may enable students and advisors to free up time to discuss more personally compelling issues during their sessions.
Sorted by student importance
Student* and academic advisor** perspectives on essential topics to cover
- Advisors
- Students
Course selection +34%
Registration for upcoming term +35%
Discussing progress towards graduation +36%
Picking a major or field of study +20%
Career options and interests +5%
Reviewing transfer credit +13%
Changing major or field of study +21%
Financial issues -15%
Academic policies +20%
Setting personal goals +14%
Referrals to other support services +28%
Non-degree credentials -28%
Campus safety -28%
Credit for prior learning outside the classroom +2%
Notes: *Survey question: “Advisor meetings can cover a variety of topics. Please indicate whether you think the following topics are important or not important for you to discuss with your academic advisor (regardless of whether you actually cover the topics). The ‘Don’t know / NA’ column is chosen by default, so please make sure to change it (if applicable) to express your opinion.”, student n = 1,337, “Internships and other experiential experiences” hidden from chart, 46% of students selected (not asked in advisor survey); **Survey question: “Academic advising meetings can cover a variety of topics. Please indicate whether you think these topics are essential for you to discuss with students in your caseload.”, advisor n = 682, academic advisors include primary role and faculty academic advisors
Sources: Driving Toward a Degree 2025, Listening to Learners 2025, Tyton Partners analysis
To best enhance student belonging, institutions should align their student support co-location strategies with how learners can best access them.
Students who attend institutions with a “one stop shop” model for support services report the highest levels of belonging across all institution types. 4-year public institutions stand out where over half of these students say they “strongly agree” they belong. In contrast, students at institutions with more fragmented or virtual support delivery are less likely to feel connected. These findings reinforce the role of integrated, easily accessible support environments in fostering a sense of belonging.
Student sense of belonging* by student reported institution type and physical location**
- Strongly disagree that I feel I belong at my school
- Neutral
- Strongly agree that I feel like I belong at my school
Majority delivered virtually
Separate locations
Mini hubs
One stop shop
- Strongly disagree
- Neutral
- Strongly agree
Majority delivered virtually
Separate locations
Mini hubs
One stop shop
- Strongly disagree
- Neutral
- Strongly agree
Majority delivered virtually
Separate locations
Mini hubs
One stop shop
*Survey questions: “To what extent do you agree or disagree with the following statements? I feel like I belong at my school.”; **Survey question: “How are these student support provider offices arranged on campus?”
Sources: Listening to Learners 2025, Tyton Partners analysis
Certain segments of students more acutely suffer from feeling a lack of belonging and resolving these disparities will require focused attention: Fully online learners and active-duty military students report lower feelings of belonging than their peers (60% vs. 68% for fully online status; 54% vs. 67% for military status). Only 62% of Hispanic students report feeling like they belong, compared to 70% of white students.
Demographic overview of students* based on sense of belonging**
- I don't feel like I belong at my school
- Neutral
- I feel like I belong at my school
Fully online/remote
Not fully online/remote
- I don't feel like I belong at my school
- Neutral
- I feel like I belong at my school
Active duty military/veteran
Not active duty military/veteran
Hispanic
AAPI
Black
AIAN
White
Notes: *Survey question: “Which of the following applies to you? Select all that apply. [Fully online/remote student] [Active Duty Military/ Military Veteran]”, Survey question: “Which of the following best represent(s) your racial heritage? Select all that apply.”; **Survey question: ”To what extent do you agree or disagree with the following statements? I feel like I belong at my school.”
Sources: Listening to Learners 2025, Tyton Partners analysis
Students who feel physically or emotionally safe on campus are significantly more likely to self-report that they will persist. This 48- and 30- percentage point swing between those that do not feel physically safe at their institution and those who do underscores that safety—like belonging and support awareness—is not just a wellness issue, it’s a retention driver. Fostering safe and inclusive environments must be a strategic imperative, not a side initiative.
Student self-reported likelihood to stay enrolled* by sentiment around physical safety**
Lowest confidence in physical safety^^
Highest confidence in physical safety^^
- Not at all likely
- Neutral
- Extremely likely
Student self-reported likelihood to stay enrolled* by sentiment around emotional safety^
Lowest confidence in emotional safety^^
Highest confidence in emotional safety^^
- Not at all likely
- Neutral
- Extremely likely
Notes: *Survey questions: ”How likely are you to stay enrolled at your college/university or enroll at any other college/university next term?“; **Survey question: ”To what extent do you agree or disagree with the following statements? I feel physically safe at my college/university.”; ^Survey question: “To what extent do you agree or disagree with the following statements? I feel that my campus fosters an inclusive environment for people like me”; ^^Safety questions are asked on a 5-point scale from Strongly disagree (lowest confidence) to Strongly agree (highest confidence); Don’t know/NA excluded, n=35-517
Sources: Listening to Learners 2025, Tyton Partners analysis
Learner Awareness
Students don’t just need to know support exists. They need it to feel relevant, accessible, and worth their time:
Students aware of more support services self-indicate that they are far more likely to stay enrolled, yet awareness and use remain low. Barriers go beyond knowledge to include relevance, timing, and stigma/discomfort. Still, students who engage report positive experiences, highlighting a clear opportunity to shift from availability to intentional, student-centered connection.
Students who are aware of five or more support services are significantly more likely to self-report that they will stay enrolled and feel a sense of belonging with their institution. 71% say they are “extremely likely” to re-enroll, compared to just 43% among those aware of fewer supports. This 28-point difference highlights awareness as a critical, and often overlooked, factor in student persistence. Simply knowing what is available, not necessarily using them, is a key driver of continued enrollment: the more supports a students report awareness of, the greater their stated likelihood of re-enrollment (**R² = .17, F(11,842) = 15.25, p < .001)^^.
Student self-reported likelihood to stay enrolled* by number of student support services aware of**
Aware of 1-4 supports
Aware of 5+ supports
- Extremely likely to re-enroll
- Neutral
- Not at all likely to re-enroll
Student sense of belonging^ by number of student support services aware of**
Aware of 1-4 supports
Aware of 5+ supports
- Feel like I belong
- Neutral
- Don't feel like I belong
Notes: *Survey question: “How likely are you to stay enrolled at your college/university or enroll at any other college/university next term?”; **Survey question: “Which of the following support services are available to you at your institution? Select all that apply”, (15 options provided), n=848 (Aware of 1-4 supports), n=372 (Aware of 5+ supports). The difference between 43% and 71% is significant at the 95% confidence level.; ^Survey question: ”To what extent do you agree or disagree with the following statements? I feel like I belong at my school.” ^^Model included other key demographic variables traditionally linked to retention, as well as student sentiments regarding ability to pass courses, graduate, pay for college, and get a job.
Sources: Listening to Learners 2025, Tyton Partners analysis
While most support services are widely available at institutions, student awareness and usage lag significantly. In some cases, fewer than 1 in 10 students report using services that over 90% of institutions offer. This stark disconnect suggests that availability alone is not enough; institutions must focus on visibility and communication to close the awareness-to-engagement gap.
Administrators, frontline staff/advisors, and students
Institutional availability,* student awareness,** student use^ of support services
- Institution availability
- Student awareness
- Student use
Academic advising
Accessibility / Disability services
Academic registration / Registrar
Library and research assistance
Tutoring and academic support
IT or technology assistance
Mental health counseling
Campus police/security
Career advising
Financial aid counseling
Emergency assistance
Military / VA benefits
Student health clinic
Mentoring programs
Student success coaches
Notes: *Survey question: “Which of the following student support services are available to students at your institution? Select all that apply.”, n = 1,568; **Survey question: “Which of the following support services are available to you at your college/university? Select all that apply.”, n = 1,442; ^Survey question: “Which of the following support providers have you ever personally interacted with at your current college/university? Select all that apply.”, n = 1,308
Sources: Driving Toward a Degree 2025, Listening to Learners 2025, Tyton Partners analysis
Awareness of student supports is particularly low among some students of color. Black students report the lowest awareness of every key student support service, from academic advising to mental health counseling (an average of 30% are aware of these supports). This gap is especially troubling given that awareness is a prerequisite for access and use.
By self-reported race/ethnicity
Student awareness of key supports*
- AAPI
- White
- Hispanic/Latino
- Black
Academic advising
Financial aid counseling
Career advising
Mental health counseling
Note: *Survey question: “Which of the following support services were available to you at the college/university [in which you were last enrolled]? Select all that apply.”, n=336 (White), n=285 (Hispanic/Latinx), n=390 (Black), n=126 (AAPI); Students who selected multiple races were excluded from analysis to maintain fidelity between comparison groups
Sources: Listening to Learners 2025, Tyton Partners analysis
Student uptake challenges extend to pre-orientation programs, a key opportunity to support the first-year experience and begin to cultivate a sense of belonging. For example, while 46% of students report being offered leadership and service programs, only 23% participated. This gap again suggests a mismatch between what is offered by institutions, what students know is offered, and what students engage with, pointing to an opportunity for improved outreach and stronger alignment to student interests.
Students
First-time/ first-year advising experiences students know are offered and participation rates* **
- Offered (aware of)
- Participated
Academic preparation programs
Cultural or identity-based programs
Health & wellness programs
Leadership & service programs
Residential living & community building
International student orientations
Outdoor/wilderness programs
None
Notes: *Survey question: “What types of pre-orientation programming did your school offer? These programs typically occur in the summer before first-year orientation.”, n = 928, stems with <10% responses are hidden; **Survey question: “What types of pre-orientation programming did you participate in? Select all that apply.”, n = 842
Sources: Listening to Learners 2025, Tyton Partners analysis
While awareness is a foundational barrier to engaging with student supports, students face additional challenges that go beyond simply knowing a service exists. Among those aware of supports, top reasons for non-use include inconvenient hours (30%), uncertainty about relevance (42%), and stigma (30%). Some of these barriers, like inconvenience, are underestimated by administrators and staff. To drive engagement, institutions must not only increase awareness but also ensure supports are accessible, clearly positioned, and attuned to student needs.
Top student usage barriers
- Past negative experiences
- Inconvenient hours or access
- Uncertainty about relevance
- Stigma or discomfort
- Lack of awareness
Administrators and frontline staff/advisors*
- Inconvenient hours or access
- Uncertainty about relevance
- Stigma or discomfort
Students**
Notes: *Survey question: “From your perspective, what is the primary barrier to students using support services?”, n = 1,516, answer choices “Other, please specify” and “Don’t know” excluded from analysis; **Survey question: “Why do you not use available student support(s)? For each of the listed student supports, select all that apply.”, n = 1,363, Answer stems were grouped to match the administrator response more clearly. “Stigma or discomfort” includes “Don’t feel safe using support services”, “Uncertainty about relevance” takes the average across “Supports is not for students like me”, “Want to do things on my own”, “Doubt it will be helpful”, and “Have not needed”, “Inconvenient ours or access” takes the average across “Inconvenient reminder timing”, “Inconvenient reminder method”, “Wait time is too long”, “No walk-in hours”, “No flexibility in modality”, “Inconvenient hours”
Sources: Driving Toward a Degree 2025, Listening to Learners 2025, Tyton Partners analysis
Building on the idea that barriers extend beyond awareness, students cite a range of practical and perceptual reasons for not engaging with available supports. Many prefer to handle things on their own or question whether services are designed for “students like me.” Others report poor timing, long wait times, or inflexible formats, underscoring that even well-known supports may go unused if they feel inaccessible, irrelevant, or unwelcoming.
Student reasons for not using available student supports*
- Uncertainty about relevance
- Hours/access
- Discomfort
Want to do things on my own
Support is not for students like me
Doubt it will be helpful
Have not needed
Inconvenient reminder timing
Wait time is too long
Inconvenient reminder method
Inconvenient hours
No time
No walk-in hours
No flexibility in modality
Don’t feel safe when using
Notes: *Survey question: “Why do you not use available student support(s)? For each of the listed student supports, select all that apply.”, n=1,363
Sources: Listening to Learners 2025, Tyton Partners analysis
Some of the most impactful services, like tutoring and peer mentoring, are among the least used. These supports yield the highest persistence rates and satisfaction (NPS) among users but fall below average in utilization, signaling an untapped ROI for institutions. Bridging this gap through stronger promotion and access could drive meaningful improvements in student success with minimal new investment. This signals a clear opportunity: the issue is not necessarily service quality but rather getting students in the door.
Career Readiness
Career readiness is a key bridge between student demands and institutional ROI:
Career readiness is a broad term; this section focuses in on one aspect of it. For more information on career readiness, see Tyton Partners’ Driving Toward a Degree.
Students show strong interest in non-degree credentials (NDCs), a component of broader career readiness programs/strategies that students see as a strong advancement opportunity. Yet, faculty remain hesitant or unprepared to integrate NDCs and other aspects of career readiness more holistically into the curriculum, and support providers outside of the classroom are uncertain how to answer questions about NDCs. Institutions that invest in career-aligned pathways and build confidence across stakeholders—especially faculty—can better meet student demand and strengthen long-term value.
Career readiness is tightly linked to perceptions of college value among both students and staff. Across both students and institutional stakeholders, nearly all who believecollege is worth the cost also believe it prepares students well for careers, while those who doubt career preparation are far more likely to question the ROI. Institutionslooking to reinforce value should continue elevating career outcomes as a central student success metric.
Administrators & frontline staff/advisors
Belief in workforce readiness*, by perceived college value**
Do not believe college prepares students well for jobs/careers
Believe college prepares students well for jobs/careers
- Believe college is not worth the cost
- Believe college is worth the cost
Students
Belief in workforce readiness*, by perceived college value**
Do not believe college prepares students well for jobs/careers
Believe college prepares students well for jobs/careers
- Believe college is not worth the cost
- Believe college is worth the cost
Notes: *Survey question: “How much do you agree or disagree with the following?”, Statements “College prepares students/ me well for jobs/careers” and “Education at my college/university is worth the cost”, responses to each cross-tabulated; **Segments for agreement are those that “Agree” or “Strongly agree”, segments for disagreement are “Disagree” and “Strongly disagree” (“Neutral” excluded from analysis)
Sources: Driving Toward a Degree 2025, Listening to Learners 2025, Tyton Partners analysis
Student demand for non-degree credentials (NDCs) is strong: Half are aware of these options and nearly 90% express at least some interest, with equal student demand across community colleges and 4-year institutions. These trends point to a growing expectation that institutions need to offer flexible, career-aligned pathways beyond the traditional degree.
Students
Awareness of and interest in non-degree credentials (NDCs)* **
- Not aware
- Somewhat aware
- Very aware
Students
Awareness of and interest in non-degree credentials (NDCs)* **
2-Year
4-Year Public
4-Year Private
- Not interested
- Somewhat interested
- Very interested
Notes: *Survey question: How aware are you of non-degree credentials (e.g., certificates, micro-credentials, industry certifications, digital badges) as a supplement to a traditional degree/credits? Select one., n=1,528; **Survey question: “How interested are you in non-degree credentials (e.g., certificates, micro-credentials, industry certifications, digital badges) as a supplement to a traditional degree/credits? Select one.”, 2-year n=360, 4-year Public n=725, 4-year Private n=238
Sources: Listening to Learners 2025, Tyton Partners analysis
Available institutional NDC offerings do not reflect students’ equal demand for them by sector. Two-thirds of community colleges already offer NDCs and plan to expand, and 71% expect these offerings to become a significant revenue source in the next three years. In contrast, 4-year institutions are less likely to scale NDCs or anticipate strong financial returns. This signals an important moment for providers and institutional leaders to invest in scaling NDC infrastructure, especially at 4-year institutions where student demand is already present but institutional readiness lags behind.
Career services staff and administrators^
Approach to non-degree credentials (NDCs)*
2-Year (n=36)
4-Year Public (n=71)
4-Year Private (n=85)
- Don’t offer, no plans to start
- Don’t offer, but plan to start
- Offer now, no plans to expand
- Offer now and plan to expand
Career services staff and administrators^
Significance of NDCs as a revenue source in the next three years**
2-Year (n=28)
4-Year Public (n=44)
4-Year Private (n=65)
- No – NDCs will not be a significant revenue source
- Yes – NDCs will be a significant revenue source
Notes: *Survey question: “Which best describes your institution’s current and planned approach to non-degree credentials (e.g., certificates, micro credentials, digital badges) over the next three years?”, 2-year n = 36, 4-year Public n = 71, 4-year Private n = 85, “Don’t know” (n = 4, 25, 24) is hidden; **Survey question: “Does your institution expect non-degree credentials to be a significant source of revenue in the next three years?”, 2-year n = 28, 4-year Public n = 44, 4-year Private n = 65, “Don’t know” (n = 96, 109, 40) is hidden; ^Administrators only include those with career services purview
Sources: Driving Toward a Degree 2025, Tyton Partners analysis
Institutional student support staff confidence in referring students to NDC-related resources is mixed. Nearly half of respondents at four-year institutions report neutral or low confidence in referring students to NDC pathways. Bridging the gap between student interest in NDCs and institutional ability to offer them is essential to career-readiness strategies.
Career services staff and administrators at institutions offering NDCs
Confidence in referring students to NDC-related resources*
- Not at all confident
- Neutral
- Extremely confident
2-Year
4-Year Public
4-Year Private
Note: *Survey question: “How confident do you feel in your ability to direct students to the appropriate institutional resources for non-degree credential programs (e.g., micro-credentials, apprenticeships, bootcamps)?”, 4-year Public n = 781, 4-year Private n = 372, 2-year n = 161, answer choice “Do not offer NDCs” excluded
Sources: Driving Toward a Degree 2025, Tyton Partners analysis
Instructor openness to incorporating NDCs into their courses decreases with tenure. This suggests that while enthusiasm varies, there is a baseline willingness across experience levels. To turn sentiment into action, institutions should invest in modular course design tools (potentially leveraging CBE infrastructure) and clear implementation pathways that make it easier for instructors, regardless of tenure, to integrate NDCs into their courses.
Instructor sentiments toward non-degree credentials, by tenure*
- >20 years in role
- 8-20 years in role
- <7 years in role
I am NOT open to modifying my course to enable my students to earn non-degree credentials through my institution
00I am open to modifying my course to enable my students to earn non-degree credentials through my institution
100Note: *Survey question: “For the next questions, please read each pair of statements and decide to what extent you agree with one more than the other regarding non-degree credentials (e.g., certificates, micro-credentials, industry certifications, digital badges). A non-degree credential is a certification, micro-credential, digital badge, or industry-recognized certificate that demonstrates specific skills or knowledge. These credentials are typically focused on practical skills and designed to boost employability in a particular field.”, n=1,245
Sources: Time for Class 2025 Surveys, Tyton Partners analysis
GenAI Use
Generative AI is embedded in student life and is here to stay:
Students are using generative AI tools regularly both in and out of the classroom and often ahead of institutional adoption. However, they remain cautious about how and where genAI fits into their learning, preferring human-centered support and retaining mixed views on faculty use. As usage accelerates, institutions must respond with thoughtful, guided integration to meet students where they are. In addition, institutional policy updates should consider faculty use of generative AI tools and the student perspective, not just student use and faculty concern.
Use of generative AI tools is rising sharply across all higher education stakeholders, but students are leading the way. 42% of students now use genAI weekly or daily, 10pp more than instructors and support staff. As students normalize genAI in their academic lives, institutions must catch up to meet expectations and understand shifting behaviors.
Time series of generative AI tool usage frequency*
- Never used
- Used 1-2 times
- Use monthly
- Use daily or weekly
Spring 2023
Spring 2024
Spring 2025
Notes: *Survey questions: “Which of the following best describes your own use of generative AI tools (e.g., ChatGPT, Bard/Gemini) for work?”, Instructor n (Spring 2025) = 1,572, Administrator n (Spring 2025) = 730, Student n (Spring 2025) = 1,529 Instructor n (Spring 2024) = 1827, Administrator n (Spring 2024) = 316, Student n (Spring 2024) = 1526; “Which of the following best describes your own use of generative AI writing tools (e.g., ChatGPT)?” instructor n (Fall 2023) = 1,601, instructor n (Fall 2023) = 1,001; “Which of the following best describes your own use of generative AI writing tools (e.g., ChatGPT)?” Instructor n (Spring 2023) = 1748, Administrator n (Spring 2023) = 306, Student n (Spring 2023) = 1545; **Administrator data for Spring 2025 is merged across unique administrative respondents in Time for Class and Driving Toward a Degree surveys; ^Did not test in 2023 survey
Sources: Time for Class 2023 – 2025 Surveys, Driving Toward a Degree 2025, Tyton Partners analysis
- Never used
- Used 1-2 times
- Use monthly
- Use daily or weekly
Spring 2023
Spring 2025
Spring 2025
Notes: *Survey questions: “Which of the following best describes your own use of generative AI tools (e.g., ChatGPT, Bard/Gemini) for work?”, Instructor n (Spring 2025) = 1,572, Administrator n (Spring 2025) = 730, Student n (Spring 2025) = 1,529 Instructor n (Spring 2024) = 1827, Administrator n (Spring 2024) = 316, Student n (Spring 2024) = 1526; “Which of the following best describes your own use of generative AI writing tools (e.g., ChatGPT)?” instructor n (Fall 2023) = 1,601, instructor n (Fall 2023) = 1,001; “Which of the following best describes your own use of generative AI writing tools (e.g., ChatGPT)?” Instructor n (Spring 2023) = 1748, Administrator n (Spring 2023) = 306, Student n (Spring 2023) = 1545; **Administrator data for Spring 2025 is merged across unique administrative respondents in Time for Class and Driving Toward a Degree surveys; ^Did not test in 2023 survey
Sources: Time for Class 2023 – 2025 Surveys, Driving Toward a Degree 2025, Tyton Partners analysis
- Never used
- Used 1-2 times
- Use monthly
- Use daily or weekly
Spring 2023
Spring 2024
Spring 2025
Notes: *Survey questions: “Which of the following best describes your own use of generative AI tools (e.g., ChatGPT, Bard/Gemini) for work?”, Instructor n (Spring 2025) = 1,572, Administrator n (Spring 2025) = 730, Student n (Spring 2025) = 1,529 Instructor n (Spring 2024) = 1827, Administrator n (Spring 2024) = 316, Student n (Spring 2024) = 1526; “Which of the following best describes your own use of generative AI writing tools (e.g., ChatGPT)?” instructor n (Fall 2023) = 1,601, instructor n (Fall 2023) = 1,001; “Which of the following best describes your own use of generative AI writing tools (e.g., ChatGPT)?” Instructor n (Spring 2023) = 1748, Administrator n (Spring 2023) = 306, Student n (Spring 2023) = 1545; **Administrator data for Spring 2025 is merged across unique administrative respondents in Time for Class and Driving Toward a Degree surveys; ^Did not test in 2023 survey
Sources: Time for Class 2023 – 2025 Surveys, Driving Toward a Degree 2025, Tyton Partners analysis
- Never used
- Used 1-2 times
- Use monthly
- Use daily or weekly
Spring 2023
Spring 2024
Spring 2025
Notes: *Survey questions: “Which of the following best describes your own use of generative AI tools (e.g., ChatGPT, Bard/Gemini) for work?”, Instructor n (Spring 2025) = 1,572, Administrator n (Spring 2025) = 730, Student n (Spring 2025) = 1,529 Instructor n (Spring 2024) = 1827, Administrator n (Spring 2024) = 316, Student n (Spring 2024) = 1526; “Which of the following best describes your own use of generative AI writing tools (e.g., ChatGPT)?” instructor n (Fall 2023) = 1,601, instructor n (Fall 2023) = 1,001; “Which of the following best describes your own use of generative AI writing tools (e.g., ChatGPT)?” Instructor n (Spring 2023) = 1748, Administrator n (Spring 2023) = 306, Student n (Spring 2023) = 1545; **Administrator data for Spring 2025 is merged across unique administrative respondents in Time for Class and Driving Toward a Degree surveys; ^Did not test in 2023 survey
Sources: Time for Class 2023 – 2025 Surveys, Driving Toward a Degree 2025, Tyton Partners analysis
Building on students’ leadership in genAI adoption, they are also the most willing to invest in these tools. One in three frequent student users pays for a subscription to tools,outpacing instructors (20%), administrators (22%), and support staff (16%). This signals not only higher usage but deeper commitment, underscoring a growing gapbetween student behavior and institutional response.
ChatGPT remains the dominant genAI tool among students. It is used by 65% of those who have tried generative AI, nearly three times the next-most-used tool, Gemini (25%). While students experiment with a range of tools, the concentration around ChatGPT suggests a first-mover advantage and a need for other providers to communicate their genAI features more clearly and aligned to student use cases.
Among students who have used generative AI tools at least once**
Student use of genAI tools*
ChatGPT
Gemini (formerly Bard)
Snapchat AI
Meta AI (Facebook)
Quizlet Q-chat
Answer AI
Tutor AI
DeepSeek
Bing AI
Socratic
GitHub Copilot
Google Notebook LM
Course Hero AI Homework Help
Transcript
Claude
Cheggmate
Other
Don’t know
Notes: *Survey question: “Which of the following standalone generative AI tools have you used for school-related work or activities? Select all that apply.”, n=1,228; **Respondents who saw this question are current or past users of generative AI
Sources: Listening to Learners 2025 Survey, Tyton Partners analysis
While students are the most active genAI users, they still turn to instructors and peers first when struggling in class. Use of genAI for academic support has declined among students since 2024, suggesting the potential for growing skepticism about its utility in classroom learning and/or an increase in restrictive policies. In contrast, instructors are increasingly aware of genAI’s role, though they tend to overestimate its current use among students. This disconnect reinforces the opportunity for blended support strategies that pair human guidance with AI-enabled tools.
Students are demonstrating greater AI literacy. Most learners spend over two hours per week verifying outputs, which suggests low trust but high awareness of its limitations. It also demonstrates critical thinking, long considered a concern of student genAI use and a top outcome of a college credential. In contrast, 25% of instructors don’t verify genAI outputs at all. This verification gap may reflect students’ greater familiarity with genAI use and reinforces why genAI hasn’t fully displaced human-centered supports. Alternatively, this data may point to instructors’ greater subject matter expertise—when you’re confident in the right output, checking for it takes less time.
Student and instructor time spent verifying generative AI outputs*
- Students (weighted average time spent per week 2.1 hours)
- Instructors (weighted average time spent per week 1.4 hours)
I don’t spend any time verifying outputs
<1 hour
1-5 hours
5+ hours
Note: *Survey question: “How much time do you spend verifying information or output you get from generative AI tools you use for school each week?”, n=1,228 (Student), n=974 (Instructor), “Don’t know” responses are excluded from analysis
Sources: Time for Class 2025, Listening to Learners 2025, Tyton Partners analysis
Student caution around genAI use extends to faculty use for feedback and grading. 90% of non-generative AI student users prefer that faculty not use genAI in evaluating their work. Student openness to faculty genAI use increases with student genAI use – but only to an extent as 35% of even daily student users are against it.
Students
Preference for faculty genAI use for grading*, by genAI usage frequency
- Faculty should not use GenAI to provide students feedback/grade assignments
- Neutral
- Faculty should use GenAI to provide students feedback/grade assignments
Never used (n=175)
Experimenter (n=199)
Monthly user (n=323)
Weekly user (n=369)
Daily user (n= 228)
Notes: *Survey question: “Please read each pair of statements and decide to what extent you agree with one more than the other.”; **Survey question: “Which of the following best describes your own use of generative AI tools (e.g., ChatGPT) for school-related work or activities?”
Sources: Listening to Learners 2025, Tyton Partners analysis
Despite student hesitancy about faculty using generative AI for grading, only ~10% of instructors report doing so. Grading use cases are less frequent than course content generation suggesting trust in genAI’s judgment is still evolving, especially in evaluative contexts. As institutions consider new genAI policies, faculty and student usage and perspectives should all be considered.
Instructors
Current use of generative AI tools for time-savings*
Creating more engaging in-class activities
Generating quizzes and assessments
Running prompts through AI to see what students see
Teaching students how to effectively use AI
Generating writing assignments
Generating rubrics for grading student work
Generating templates to model assignment responses
Writing syllabi
Assisting with providing personalized written feedback on assignments
Assisting with grading student work
Personalizing assessments/text to student needs
Generating responses to student questions
Assisting with student learning support
Other
Note: *Survey question: “Please indicate how you use generative AI tools as they relate to saving time in teaching and learning. Select all that apply.”, n=1,242
Sources: Time for Class 2025, Tyton Partners analysis
While students are cautious about genAI in academic and high-touch support contexts, they’re more open to its use in more transactional areas. In services like course registration, students are just as likely as staff to prefer a mix of professionals and genAI tools. This suggests a strategic path forward: institutions can start by integrating genAI into time-intensive but less personalized tasks to meet student preferences while maintaining human touch where it matters most.
Preference for using automation & genAI tools
- Prefer institution only provides professionals
- Prefer a professional-first approach
- Mix of professionals and GenAI tools
- Prefer a technology-first approach
- Prefer institution only provides automated services or GenAI tools
Mental health counseling
Academic advising
Career advising
Financial aid counseling
Tutoring & academic support
Course registration
- Prefer institution only provides professionals
- Prefer a professional-first approach
- Mix of professionals and GenAI tools
- Prefer a technology-first approach
- Prefer institution only provides automated services or GenAI tools
Mental health counseling
Academic advising
Career advising
Financial aid cournseling
Tutoring & academic support
Course registration
Notes: *Survey question: “Please indicate the extent to which you would prefer your institution provide generative AI tools to student support services. Please indicate an answer for each type of support service.”, “Don’t know” stem is hidden; **Survey question: “Please indicate the extent to which you would prefer your college/university use generative AI tools to provide student support services. Please indicate an answer for each type of support service.” n = 999
Sources: Driving Toward a Degree 2025, Listening to Learners 2025, Tyton Partners analysis
Optimism about genAI’s potential in learning has grown over time, especially among administrators. Between 2023 and 2025, the share of administrators who believe genAI will positively impact student learning jumped from 35% to 55%, while instructor optimism also rose from 39% to 46%. Student sentiment, while still somewhat positive overall, declined slightly, suggesting tempered expectations. These shifts point to growing institutional comfort, likely driven by increased exposure and experimentation with genAI tools.
Sentiments regarding generative AI’s impact on student learning*
- '23 Instructors
- '25 Instructors
- '23 Administrators
- '25 Administrators
- '23 Student
- '25 Student
I believe generative AI tools will have a negative impact on student learning
00I believe generative AI tools will have a positive impact on student learning
100Instructors
Administrators
Students
Notes: *Survey question: “For the following question, please read the pair of statements and decide to what extent you agree with one more than the other.” Administrator n=61-672, Instructor n=330-864, Student n=228-1000; **Administrator data for Spring 2025 is merged across unique administrative respondents in Time for Class and Driving Toward a Degree surveys
Sources: Time for Class 2023 & 2025, Listening to Learners 2023 & 2025, Tyton Partners analysis
As institutional familiarity with genAI grows, so does belief in its long-term relevance, particularly among administrators and instructors. In 2025, more of these stakeholders view genAI as essential for student career readiness, even as student urgency has slightly declined. Support for institutional responsibility in building genAI fluency has somewhat held steady among administrators and instructors.
Instructor, administrator, and student sentiments toward generative AI*,**
- '23 Instructors
- '25 Instructors
- '23 Administrators
- '25 Administrators
- '23 Student
- '25 Student
I believe (I/students) will NOT need to know how to use generative AI tools for future jobs/careers
00I believe (I/students) will need to know how to use generative AI tools for future jobs/careers
100Instructors
Administrators
Student
- '23 Instructors
- '25 Instructors
- '23 Administrators
- '25 Administrators
- '23 Student
- '25 Student
I believe it is NOT the responsibility of the institution to teach (me/students) how to effectively interface with generative AI tools
00I believe it IS the responsibility of the institution to teach (me/students) how to effectively interface with generative AI tools
100Instructor
Administrators
Student
Notes: *Survey question: “For the next few questions, please read the pair of statement and decide to what extent you agree with one more than the other.”, instructor n=998-1,043 (2023), instructor n=1,329-1,350 (2025), administrator n=150-287 (2023), administrator n=681-684 (2025), student n=2,001-2,007 (2023), student n=1,314-1,320 (2025); **Survey language in 2023 referred to “generative AI tools” as “generative AI writing tools”, AI generative writing tools”, or “AI tools”; ^Administrator data is proxied using a similar slider, with endpoints “I believe students need to know how to effectively leverage AI generative writing tools” (0) and “I believe students do NOT need to know how to effectively leverage AI generative writing tools” (100); ^^Administrator data for Spring 2025 is merged across unique administrative respondents in Time for Class and Driving Toward a Degree surveys; ^^^Student survey statements in 2023 were “I believe I need to know how to effective use AI tools to prepare for the workplace” (0) and “I believe I do NOT need to know how to effectively use AI tools to prepare for the workplace” (100)
Sources: Time for Class 2023 & 2025, Listening to Learners 2023 & 2025, Tyton Partners analysis
Even in the face of potential institutional or instructor bans, nearly 50% of students say they are likely to continue using generative AI tools – a figure that has remained consistent in 2024 and 2025. This highlights the staying power of genAI in student workflows even if it’s not the first place students turn to when struggling with a concept in a course. To align with this reality, institutions and providers should prioritize “guardrailed” genAI integrations that promote responsible use and adapt to student use.
Students
Likelihood of using generative AI tools if institution or instructor banned them*
Spring 2024
Spring 2025
- Extremely unlikely
- Unlikely
- Neutral
- Likely
- Extremely likely
Students
Deterrents to using generative AI tools**
Failing the whole class
Getting a lower grade on my work
Being on a “watch list” for use
Knowing my instructor used an AI detector
Being suspended from school
I would not use generative AI tools if I knew they were prohibited
Nothing would deter me
- Spring 2025
- Spring 2024
*Survey question: “If your instructor or college/university banned the use of generative AI tools (e.g., ChatGPT or Google Bard/Gemini) for completing academic assignments, how likely would you be to still use generative AI tools?”, n=1,147 (Spring 2024), n=1,193 (Spring 2025); **Survey question: “If your instructor banned the use of generative AI tools for a class, which of the following potential outcomes (if any) would stop you from using the tools? Select all that apply.”, n=1,147 (Spring 2024), n=1,228 (Spring 2025)
Sources: Listening to Learners 2024 and 2025 Surveys, Tyton Partners analysis
Dual Enrollment
Dual enrollment is a high-impact on-ramp to postsecondary success:
Most dual enrollees are high school seniors taking multiple college-level courses through local institutions. Recent studies suggest this population is growing (46 percent from 2015 to 2021, and another 18 percent from 2021 to 2023) and inspired this year’s spotlight on dual enrollment. These students cite cost savings and early exposure as top motivators. Dual enrollment increases interest in attending college, but realizing its full potential requires sustained investment in tailored financial transition and academic planning supports.
Dual enrollment learners are most often high school seniors taking multiple college-level courses. The average dual enrollment student takes nearly three courses, typically through a local college or university. While one third access opportunities online, most participate through in-person experiences, suggesting a strong local institutional role in shaping early college experiences.
Key characteristics of dually-enrolled students*
- Junior in high school
- Senior in high school
Year
- 5 or more courses
- 4 courses
- 3 courses
- 2 courses
- 1 course
Number of courses
- Online through a platform that partners with a college/university
- At a local college/university
Notes: *Survey question: “What year are you in school?”, n=87; *Survey question: “How many college-level dual enrollment courses are you enrolled in this current term (Spring AY24-25)?”, n=58; *Survey question: “If you are a high school student who is currently dually enrolled, where do you take course(s)?”, n=87; **Students who indicated dual enrollment at their local high school were disqualified from survey, n=188
Sources: Listening to Learners 2025, Tyton Partners analysis
Additionally, 37% of dually enrolled students are currently pursuing natural and physical sciences in college compared to 29% of their peers who didn’t dually enroll. While this may reflect the interests of students who opt into dual enrollment, it also highlights the potential of dual enrollment pathways to attract and support learners aiming for more technical or science-focused careers. Institutions can leverage this alignment to better guide early talent into high-demand fields.
By dual enrollment history
Student field of study*
- Current students who had ever been dually enrolled in high school
- Current students who had NOT been dually enrolled in high school
Natural & physical science
Humanities & social science
Business
Math & computer science
Note: *Survey question: “What best describes your major?”, n=898 (Current students who have ever been dually enrolled while in high school), n=479 (Current students who have never been dually enrolled while in high school)
Sources: Listening to Learners 2025, Tyton Partners analysis
Dual enrollment is more than a cost-saving measure, it’s a meaningful lever for increasing student momentum toward college. Most dually enrolled students are motivated by the opportunity to earn credits early and lower tuition, but the benefits extend beyond finances. 57% say the experience increased their desire to pursue higher education. Institutions and policymakers seeking to boost postsecondary enrollment, particularly among hesitant or cost-conscious students, should view dual enrollment as a critical on-ramp worth expanding.
CURRENTLY DUALLY-ENROLLED STUDENTS
Motivation for students to dually enroll* and impact on decision to attend college**
Reasons for dually enrolling
To get ahead on college credits and reduce future tuition costs
To challenge myself academically with more advanced coursework
To explore potential career or college majors
To improve my college application and increase admissions chances
To experience what college is like before enrolling full-time
To fulfill high school graduation requirements
To gain access to college resources and experiences early
Self-reported impact of dual enrollment on decision to attend college
- Not sure (i.e., I haven’t decided yet)
- Decreased (i.e., I am less interested in attending college)
- Stayed the same (i.e., My interest in college did not change
- Increased (i.e., I am more motivated to attend college)
Notes: *Survey question: “What is the primary reason you chose to dually enroll to take college courses while in in high school?”, n=87; **Survey question: “How did taking dual enrollment courses impact your desire to enroll in college after high school?”, n=87
Sources: Listening to Learners 2025, Tyton Partners analysis
Most dual enrollment students feel confident in their academic progress and recognize the value of their dual enrollment experience. They see it as helping them complete credits (69%), prepare for future careers (64%), and prepare for college (64%). However, 23% have lower confidence in financial readiness, which suggests that institutions could pair the curricular experience with more robust guidance on college affordability for dual enrollment students.
Currently dually-enrolled students
Student sentiments*
- Strongly disagree
- Disagree
- Neutral
- Agree
- Strongly agree
I feel confident that I am on track to complete my credits
I feel my dual enrollment experience is preparing me for a job/career
I feel confident that I am going to pass my courses this term
I feel my dual enrollment experience is preparing me for college
I feel the education I’m receiving through dual enrollment is worth the cost
I feel like I belong at my college
I feel I have the resources to help me pay for college (e.g., loans, scholarships, and other aid)
Note: *Survey question: “To what extent do you agree or disagree with the following statements?”, n=83-86
Sources: Listening to Learners 2025, Tyton Partners analysis
With student interest in dual enrollment strong and its impact on college-going clear, institutions have an opportunity to sustain momentum by strengthening transition and planning supports. College transition programming and academic planning tailored to students’ future degree paths are seen as the most impactful supports, and 81% of institutions expect to sustain or grow their investment in support for dual enrollment. To unlock long-term value, institutions should continue to prioritize the programs that help dually enrolled students bridge high school and college with purpose.
Academic advisors and administrators^
Most impactful advising supports for dual enrollment student success*
College transition programming
Academic planning tailored to future degree pathways
Personalized academic advising
Structured onboarding/ orientation sessions
Career exploration/ planning tools
Academic advisors and administrators^
Resource investment in DE support over the next three years**
- Decrease resources significantly
- Decrease slightly
- Stay the same
- Increase slightly
- Increase resources significantly
Notes: *Survey question: “Which of these advising-related supports would be most impactful for dual enrollment student success at your institution?”, n = 214, stems with <5% responses and Don’t know (7%) are hidden; **Survey question: “How do you expect your institution’s investment in resources to support dual enrollment students will change over the next three years?”, n = 214, Don’t know (16%) is hidden; ^Administrators include those who have academic advising purview
Sources: Driving Toward a Degree 2025, Tyton Partners analysis
Equity-Excellence Imperative
Amid rising accountability pressures, institutions can improve outcomes by setting universal goals and tailoring strategies to ensure all students achieve them:
Equity strategies in higher education have often focused on targeted interventions for specific student groups—closing gaps in awareness, access, and outcomes but sometimes facing resistance. An increasingly accepted framework: targeted universalism is an approach which sets universal goals for student success, then tailors strategies so every student can achieve those goals. By optimizing existing student support investments and tracking their impact, institutions can prioritize utilization of support services to drive belonging, improve ROI, and boost outcomes for all students.
We’ve pulled together insights to help ensure all students receive the support they need both inside and outside the classroom.
- In digital learning, our exploration highlights practices such as leveraging course data analyses and connecting students’ backgrounds to content.
- In student support, we focus on strategies to strengthen engagement with academic advising and foster a stronger sense of belonging.
Despite increased attention to equity in digital learning, equity-minded practices remain limited and inconsistently adopted. For example, though 40% of instructors try to connect students’ backgrounds and identities to their assignments, an equity-minded practice that benefits all students, only 28% of institutions encourage it. Without stronger institutional accountability and support, equity efforts risk remaining peripheral rather than universal.
Over three-quarters of institutions, according to both administrators and instructors, do not report encouraging disaggregation of course-level data by student demographics. Even among those who do, there’s a gap in implementation: while 24% of administrators say their institutions promote the practice, only 16% of instructors report engaging in it. Unclear ownership may be a key barrier. There is no shared understanding of who’s responsible for disaggregated data, and nearly a quarter of instructors say they don’t know at all.
Analyzing disaggregated course-level data by student race/ethnicity or financial need*
- Yes
- No
Administrators report institution encourages
Instructors reporting engaging in
Notes: *Survey question: “Which of the following equity-minded practices in digital learning does your institution/do you engage in?.”, Administrator n=172 Instructor n=831
Sources: Time for Class 2025 Surveys, Tyton Partners analysis
~70% of all learners survey do not utilize academic advising. Students who don’t use academic advising are not evenly distributed: they’re more likely to be fully online (23%), first-generation (54%), and mixed-race (25%) students. This crucial information is what advisors are unable to observe and act on as the majority (58%) are not disaggregating data by student characteristics. Without intentional and tailored outreach, these learners may fall through the cracks despite the universal availability of academic advising.
Demographic overview of students who do not utilize academic advising*
- Never stopped out
- Stopped out prior
All students
Students not using academic advising
- Not fully online
- Fully online
All students
Students not using academic advising
- Not first generation
- First generation
All students
Students not using academic advising
- White
- AIAN
- AAPI
- Hispanic
- Black
- Multi-racial
All students
Students not using academic advising
Notes: *Survey question: “Which of the following applies to you? Select all that apply. [Fully online/remote student], [First-generation student (i.e., your parent(s) did not complete a 4-year college degree)]”, n=1,528 (Total sample), n=289 (Doesn’t use academic advising); *Survey question: “Which of the following best represent(s) your racial heritage? Select all that apply.”, n=1,518 (Total sample), n=286 (Doesn’t use academic advising); *Survey question: “Between starting your first year in college and today, have you ever taken a break from being enrolled (for example, taken a semester or year off)? Do not include regular breaks from college such as summer, fall, or winter breaks.”, n=1,441 (Total sample), n=289 (Doesn’t use academic advising)
Sources: Listening to Learners 2025, Tyton Partners analysis
When equity gaps in student awareness and support access go unaddressed, the risk to students compounds, especially as institutions cut identity-based programming. Institutions with decreased identity-based supports are less likely to rate their services as effectively creating belonging across the student body. As belonging is closely linked to persistence and perceived value, deprioritizing equity could undermine both student success and institutional outcomes. To avoid widening disparities, institutions must maintain targeted investments that build inclusive, high-impact support systems for all learners.
Administrators and frontline support staff/advisors
Letter grading for student support services’ ability to foster a sense of belonging for students* by identity-based supports status**
- No decrease in identity-based supports
- Decrease
A: create a sense of belonging for all students
B: create a sense of belonging for most students
C: create a sense of belonging for some students
D: create a sense of belonging for only a minority of students
F: do not create a sense of belonging
Notes: *Survey question: “If you had to assign a letter grade to your institution’s student support services in their ability to foster a sense of belonging for students, what grade would you give your institution? Please consider both inclusivity and efficacy in your grade.”; **Survey question: “In 2025, federal directives on DEI policies have presented a risk of lost federal funding for non-compliance. While this guidance has been legally challenged, it may have implications on identity-based programming and supports. To what extent do you agree with the following statement: “In the past 12 months, my institution has decreased the amount of identity-based programming and supports it offers.”, No decrease n = 768, Decrease n = 461, answer option “Neutral” excluded from segmentation (i.e., “Strongly agree” or “Agree” is “Decrease”, “Strongly disagree” or “Disagree” is “No decrease”); Statistically significant differences across all grades
Sources: Driving Toward a Degree 2025, Tyton Partners analysis
Additional Information
Have any questions? Continue the conversation below, learn about how this research was made possible, and dive into the demographics of our Listening to Learners 2025 survey.
Continue the Conversation
Reach out to us and learn how you can get involved in our higher education research.
Sponsors
Learn about how this research was made possible via our sponsors.
Demographics
Learn where our data comes from and what populations we interviewed.
Continue the Conversation
If you would like to speak to us about this work, do not hesitate to reach out!
We welcome opportunities to share this research at conferences, institutional leadership workshops, and other convenings.
We are proud of our impact on postsecondary education: including institutional case-making, industry media coverage, and durable thought leadership.
Authors


Sponsors
Listening to Learners 2025 is funded by the Gates Foundation and Macmillan Learning as our Anchor Partners.
Our research would not be possible without our survey respondents. Thank you to all the students, instructors, and administrators who so thoughtfully shared their experiences with us to enable learning and improvement.
Time for Class 2025 is funded by the Gates Foundation and McGraw Hill as our Anchor Partners. We are also grateful to D2L as an additional Product Insight Partner.
Driving Toward a Degree 2025 is funded by Lumina Foundation as our Anchor Partner, as well as Mentor Collective, QuadC, UERU, Stellic, and NACADA as Research Partners.
If you are interested in sponsoring our research, please contact info@tytonpartners.com.
Sponsors 2024 – 2025
Demographics
Listening to Learners 2025 Demographics
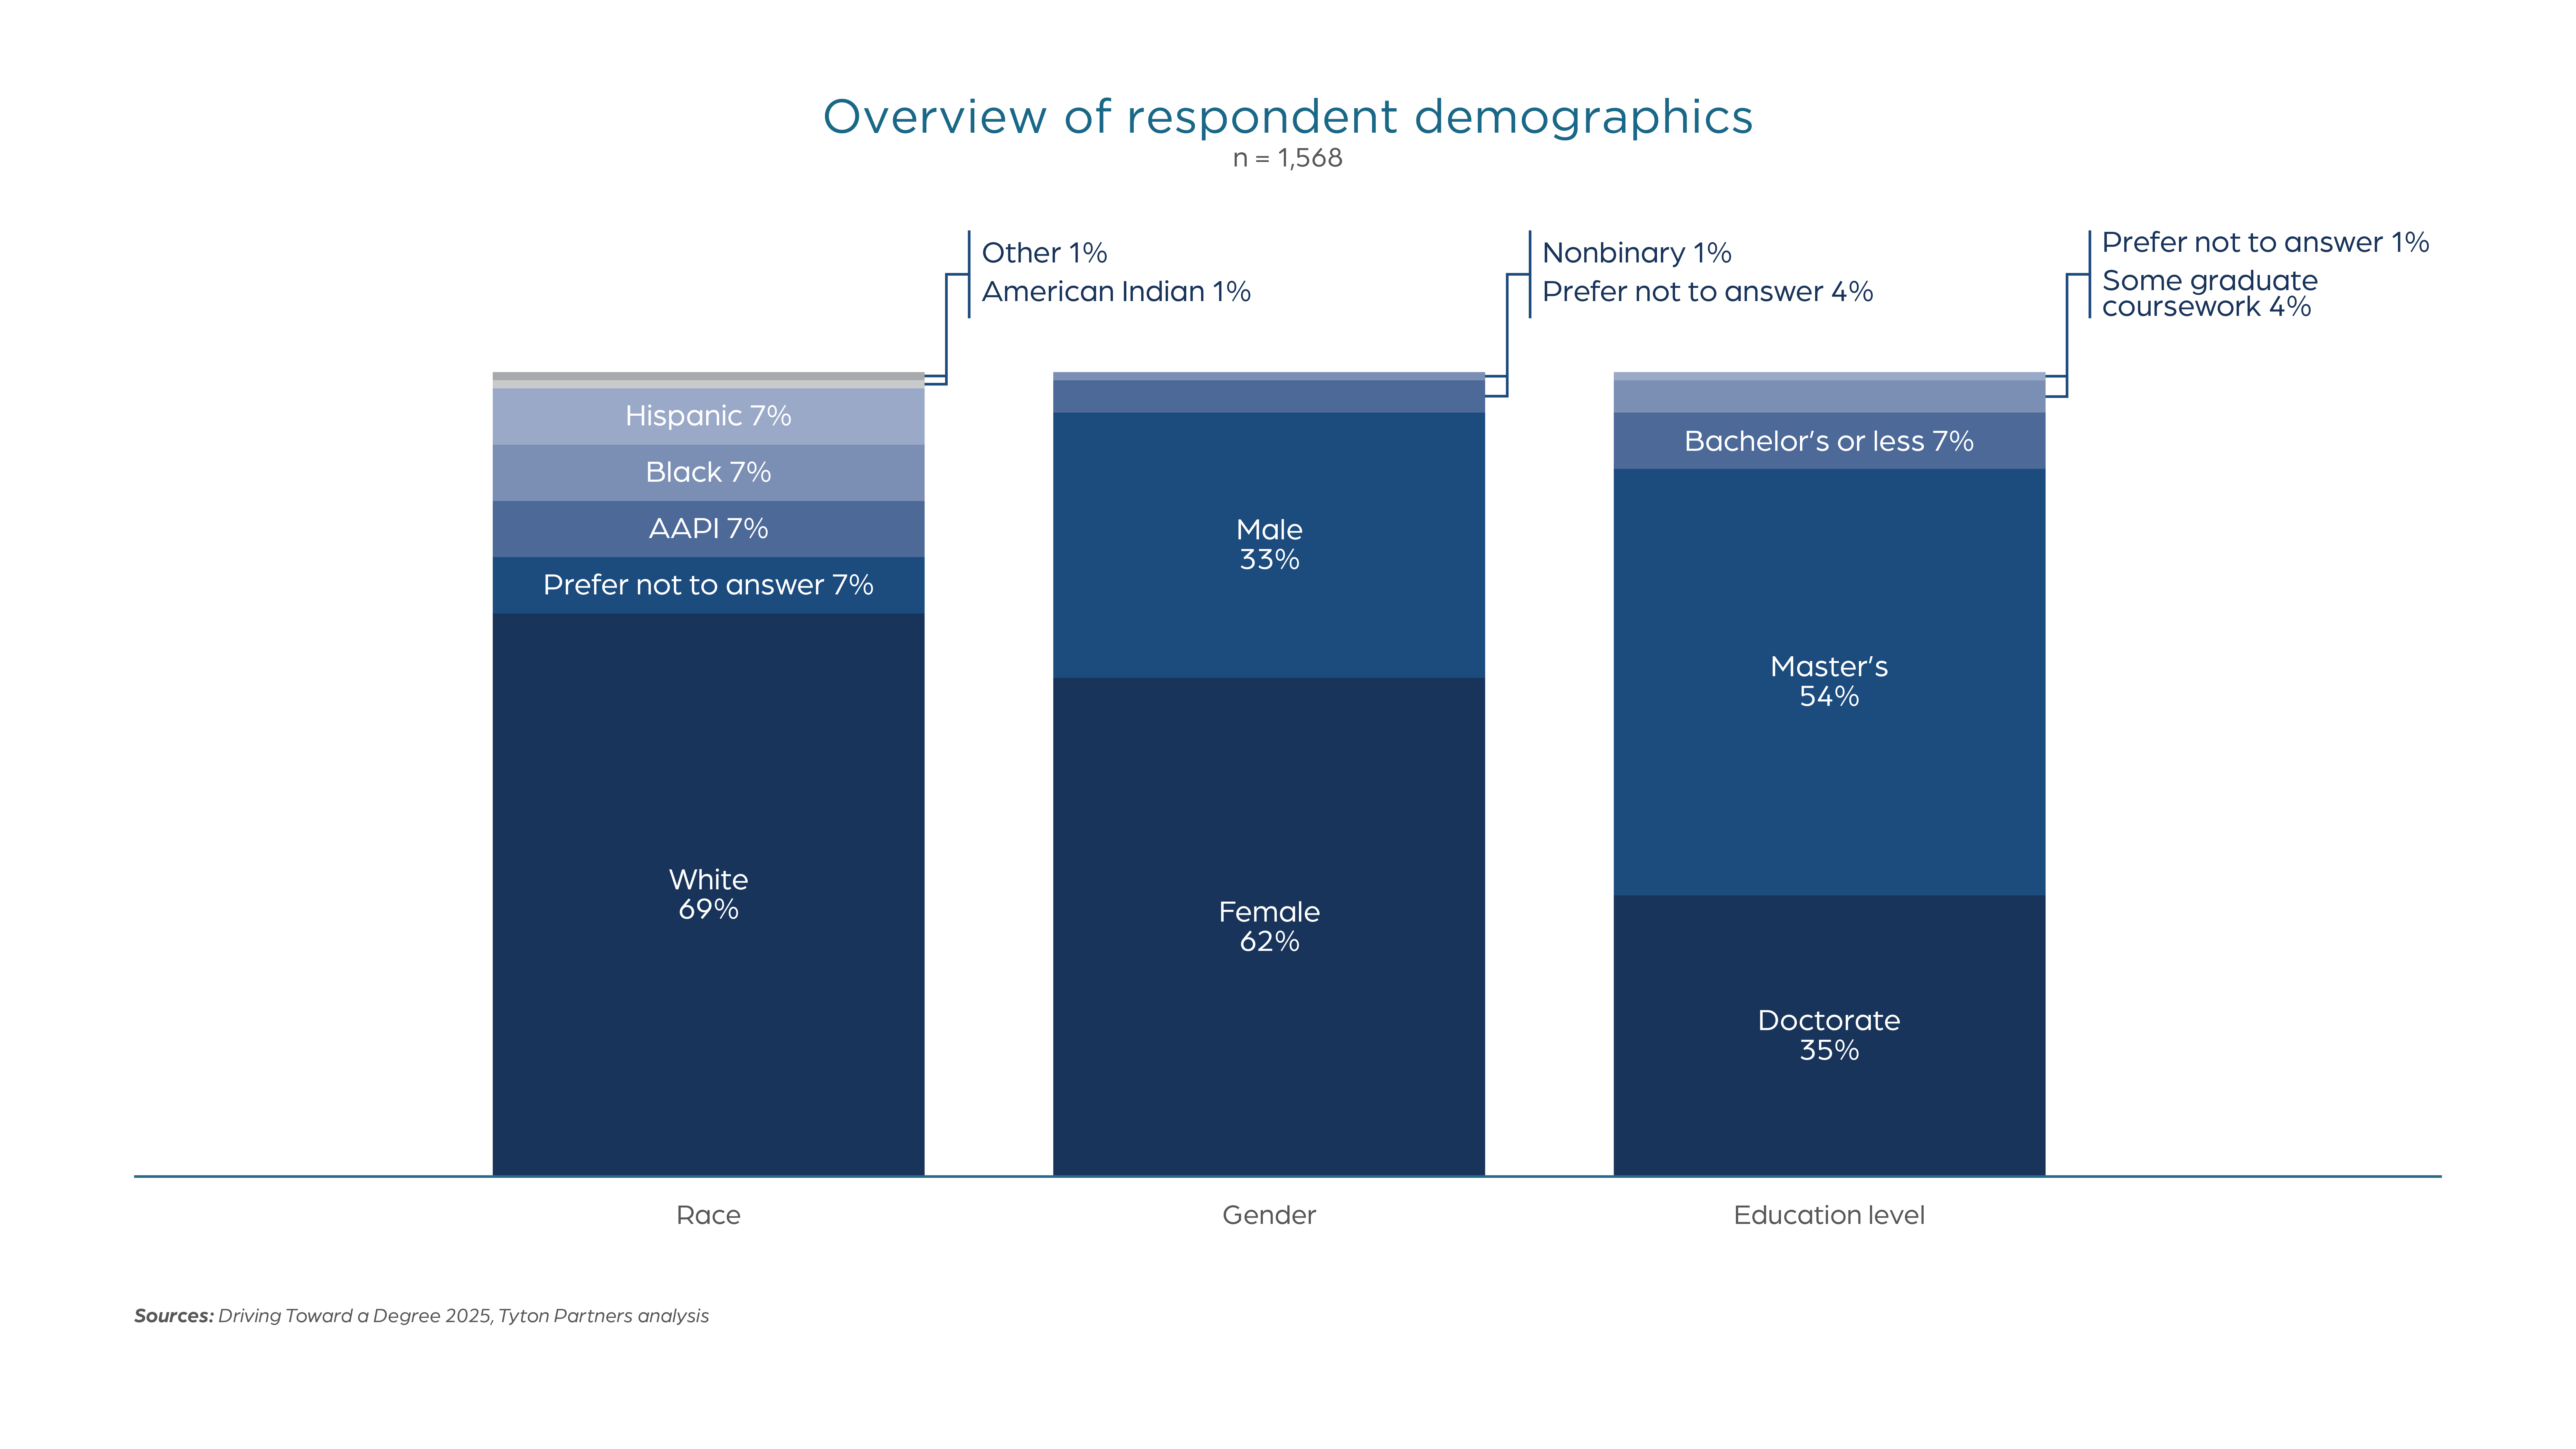
More than 1,500 students from two- and four-year private and public institutions were surveyed for Listening to Learners 2025. Student respondents represent a range of demographic backgrounds.
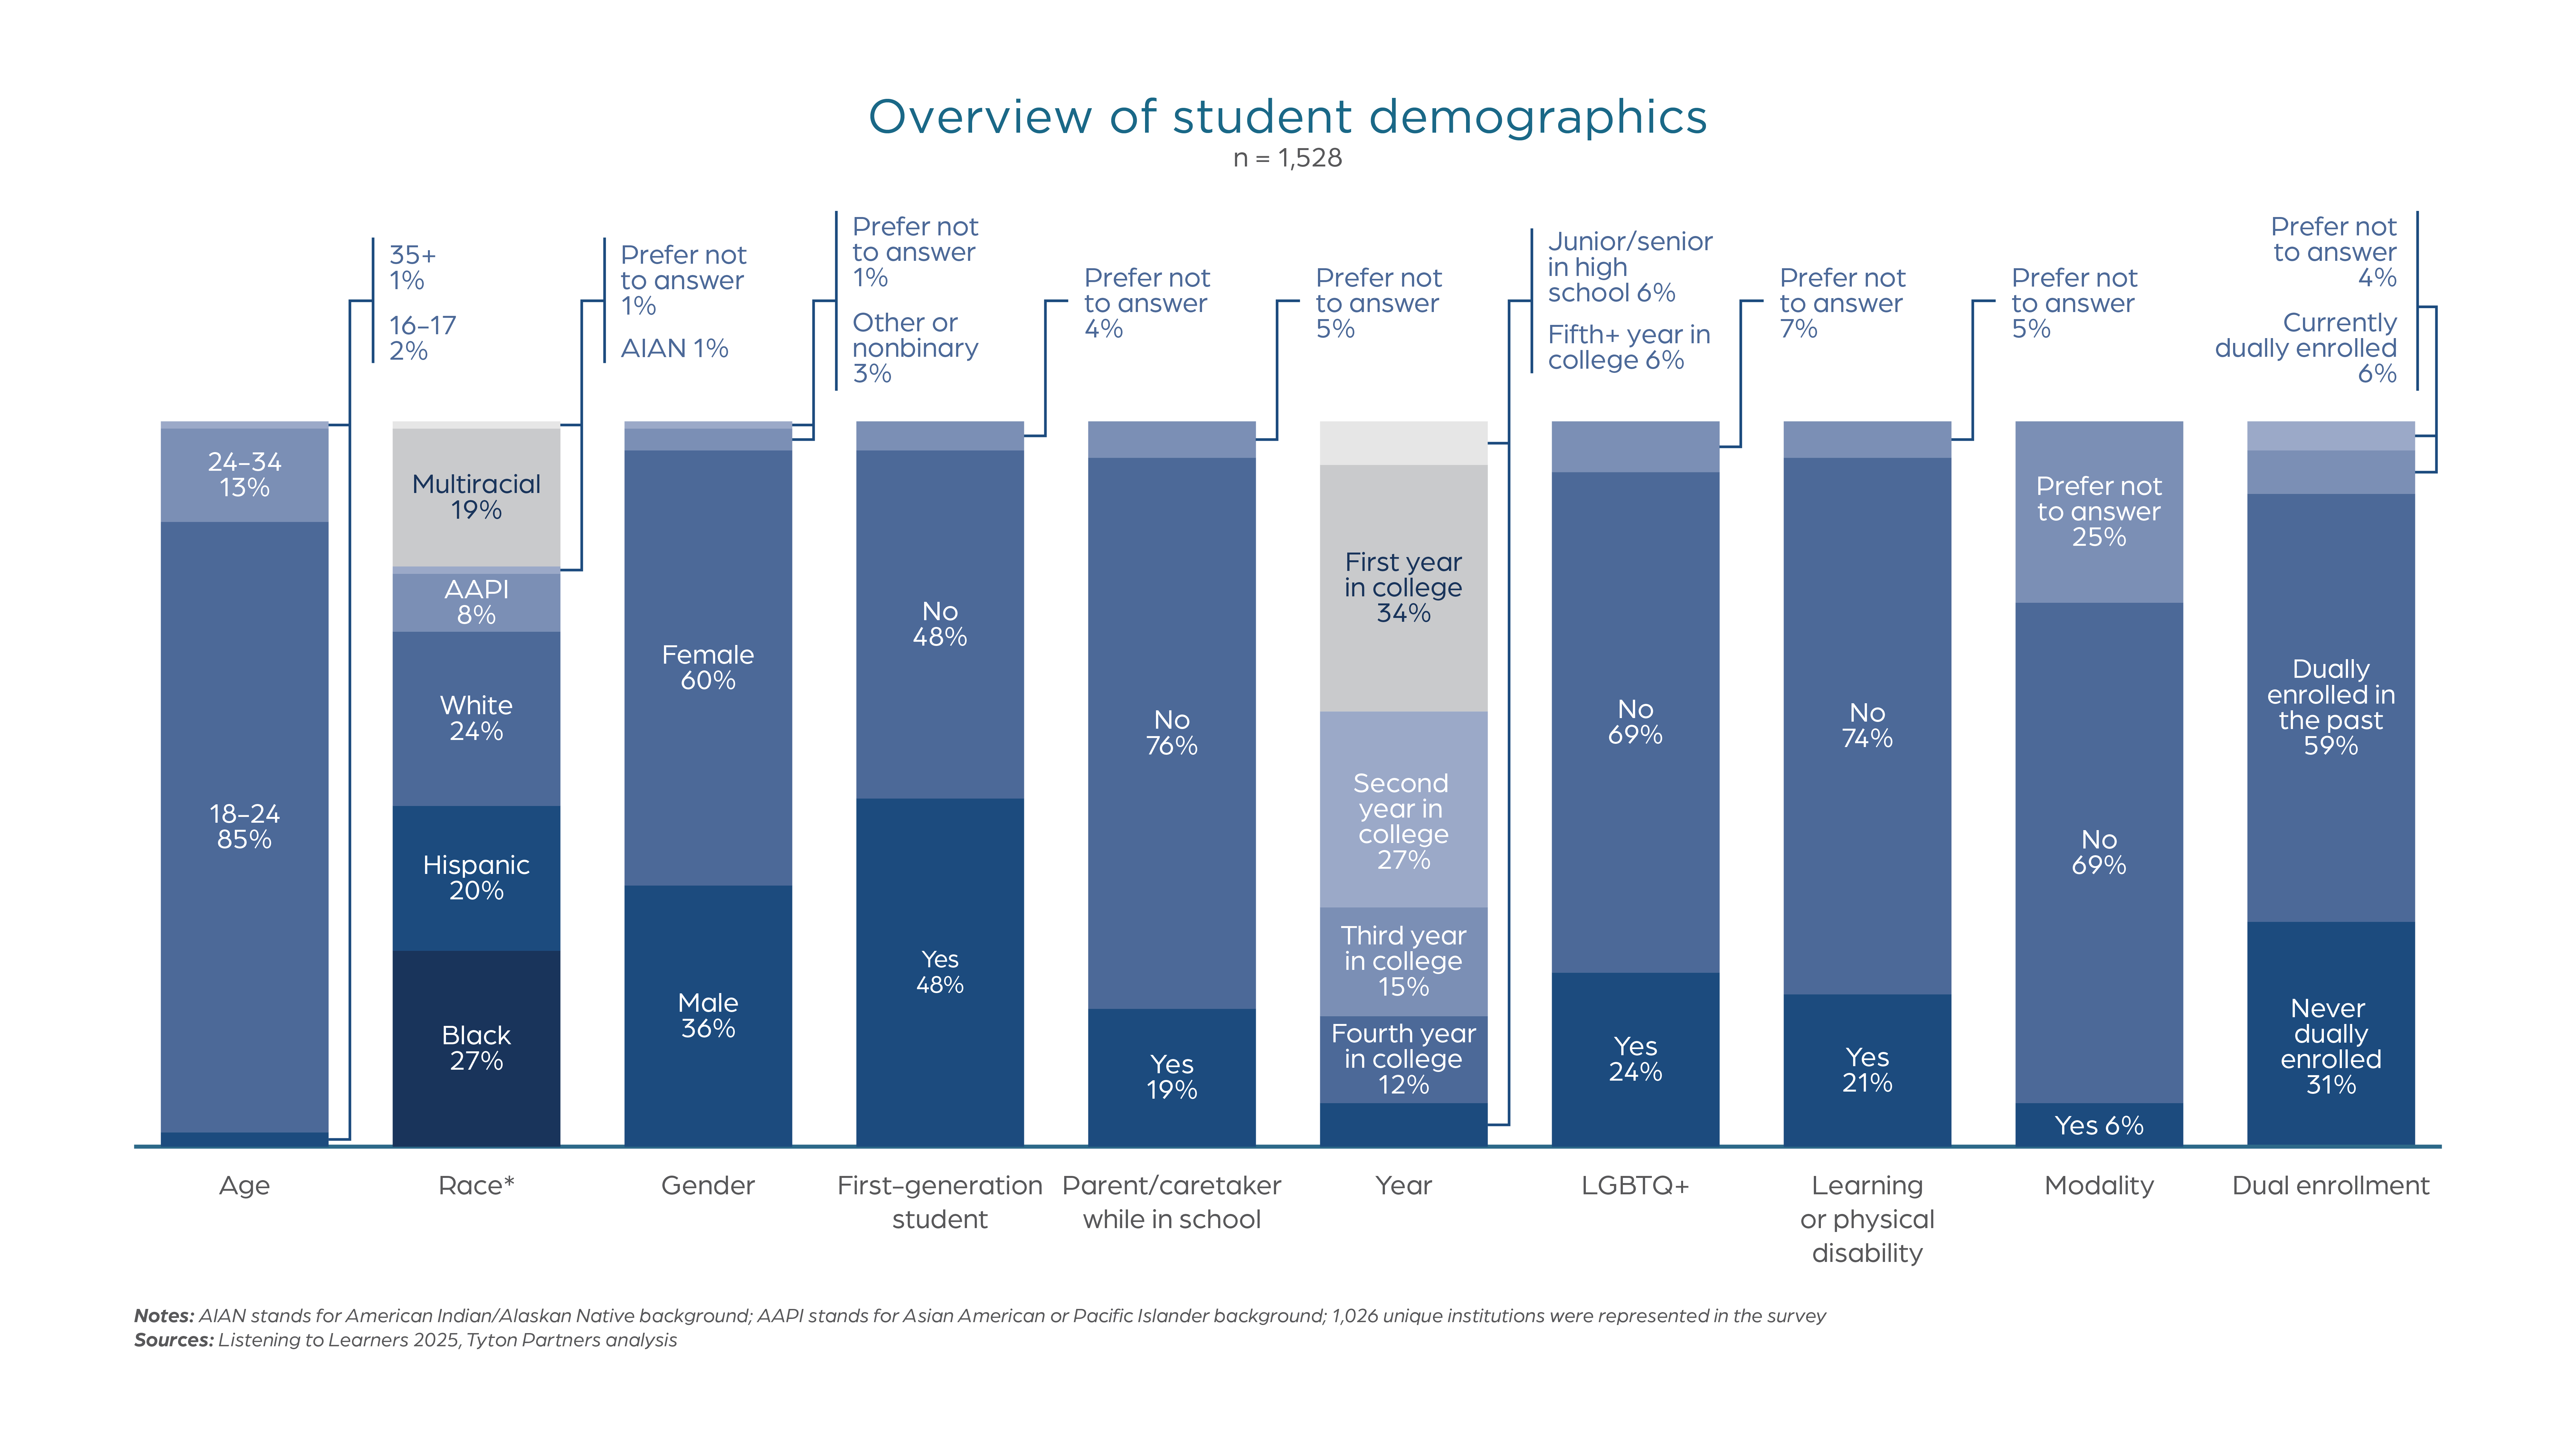
The Listening to Learner respondent pool focused on students whose experiences are of particular importance to understand (e.g., stopped out students) as we unpack the evolving nature of digital teaching and learning.
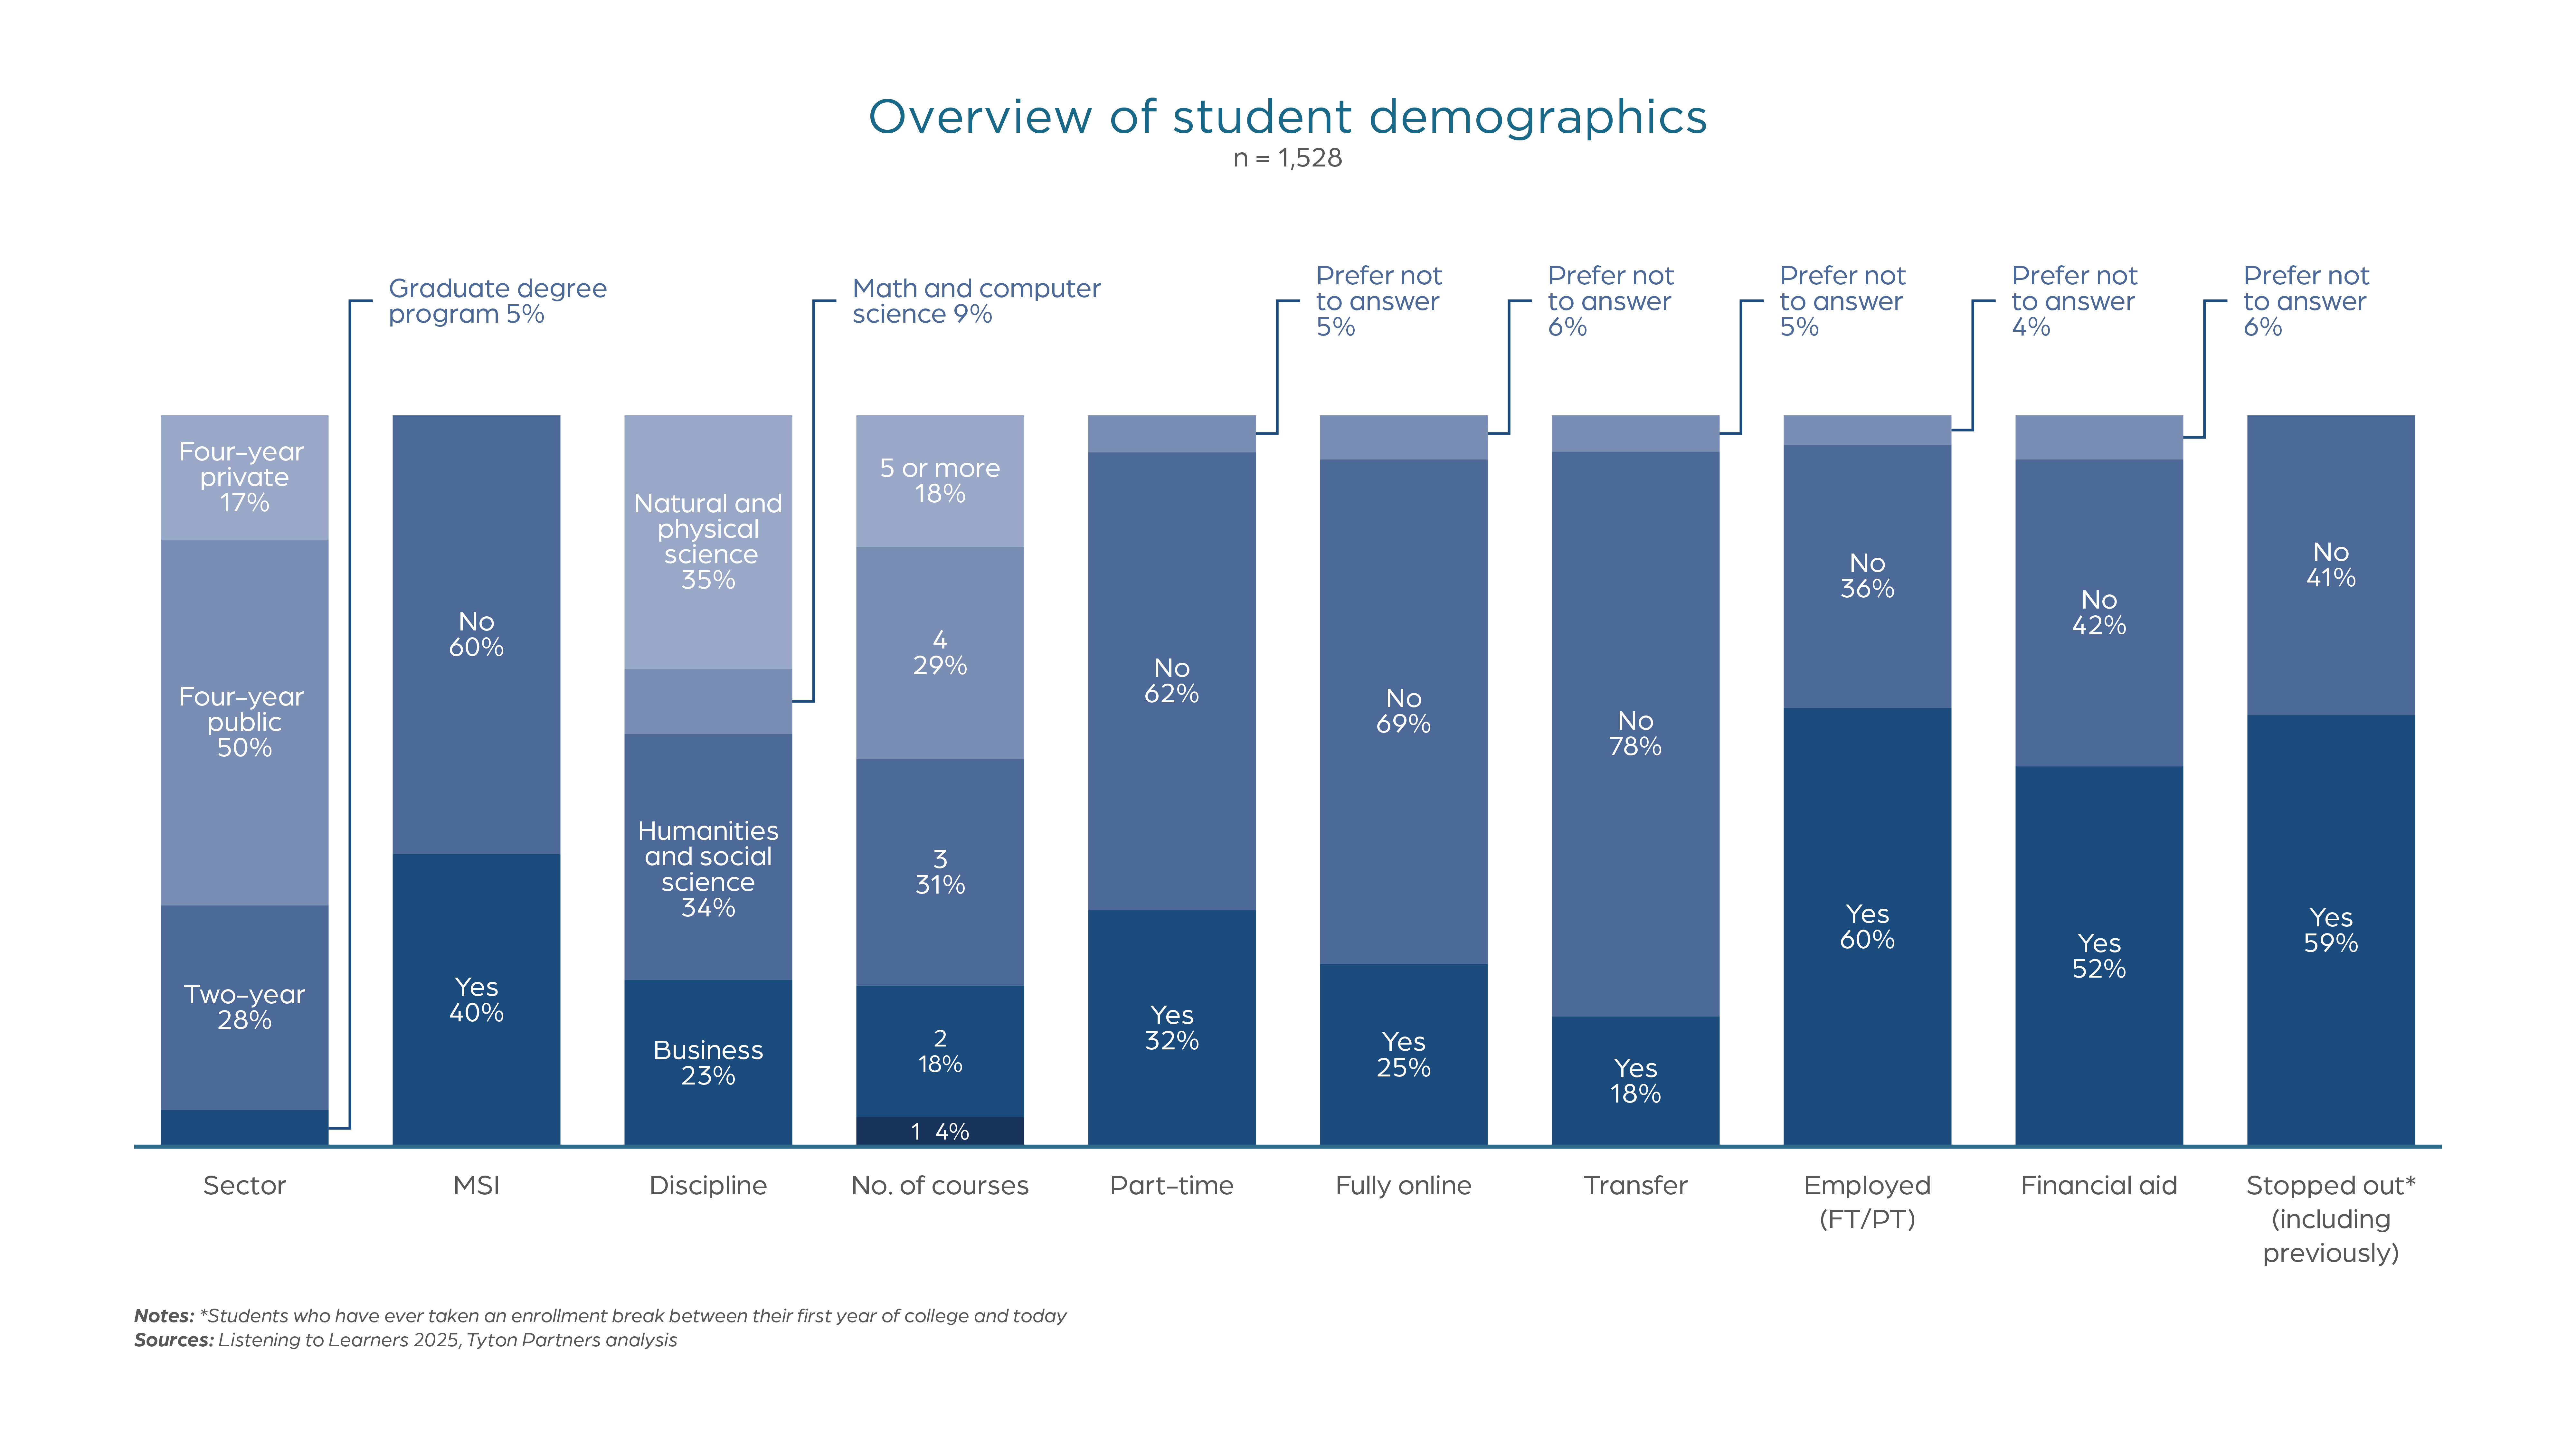
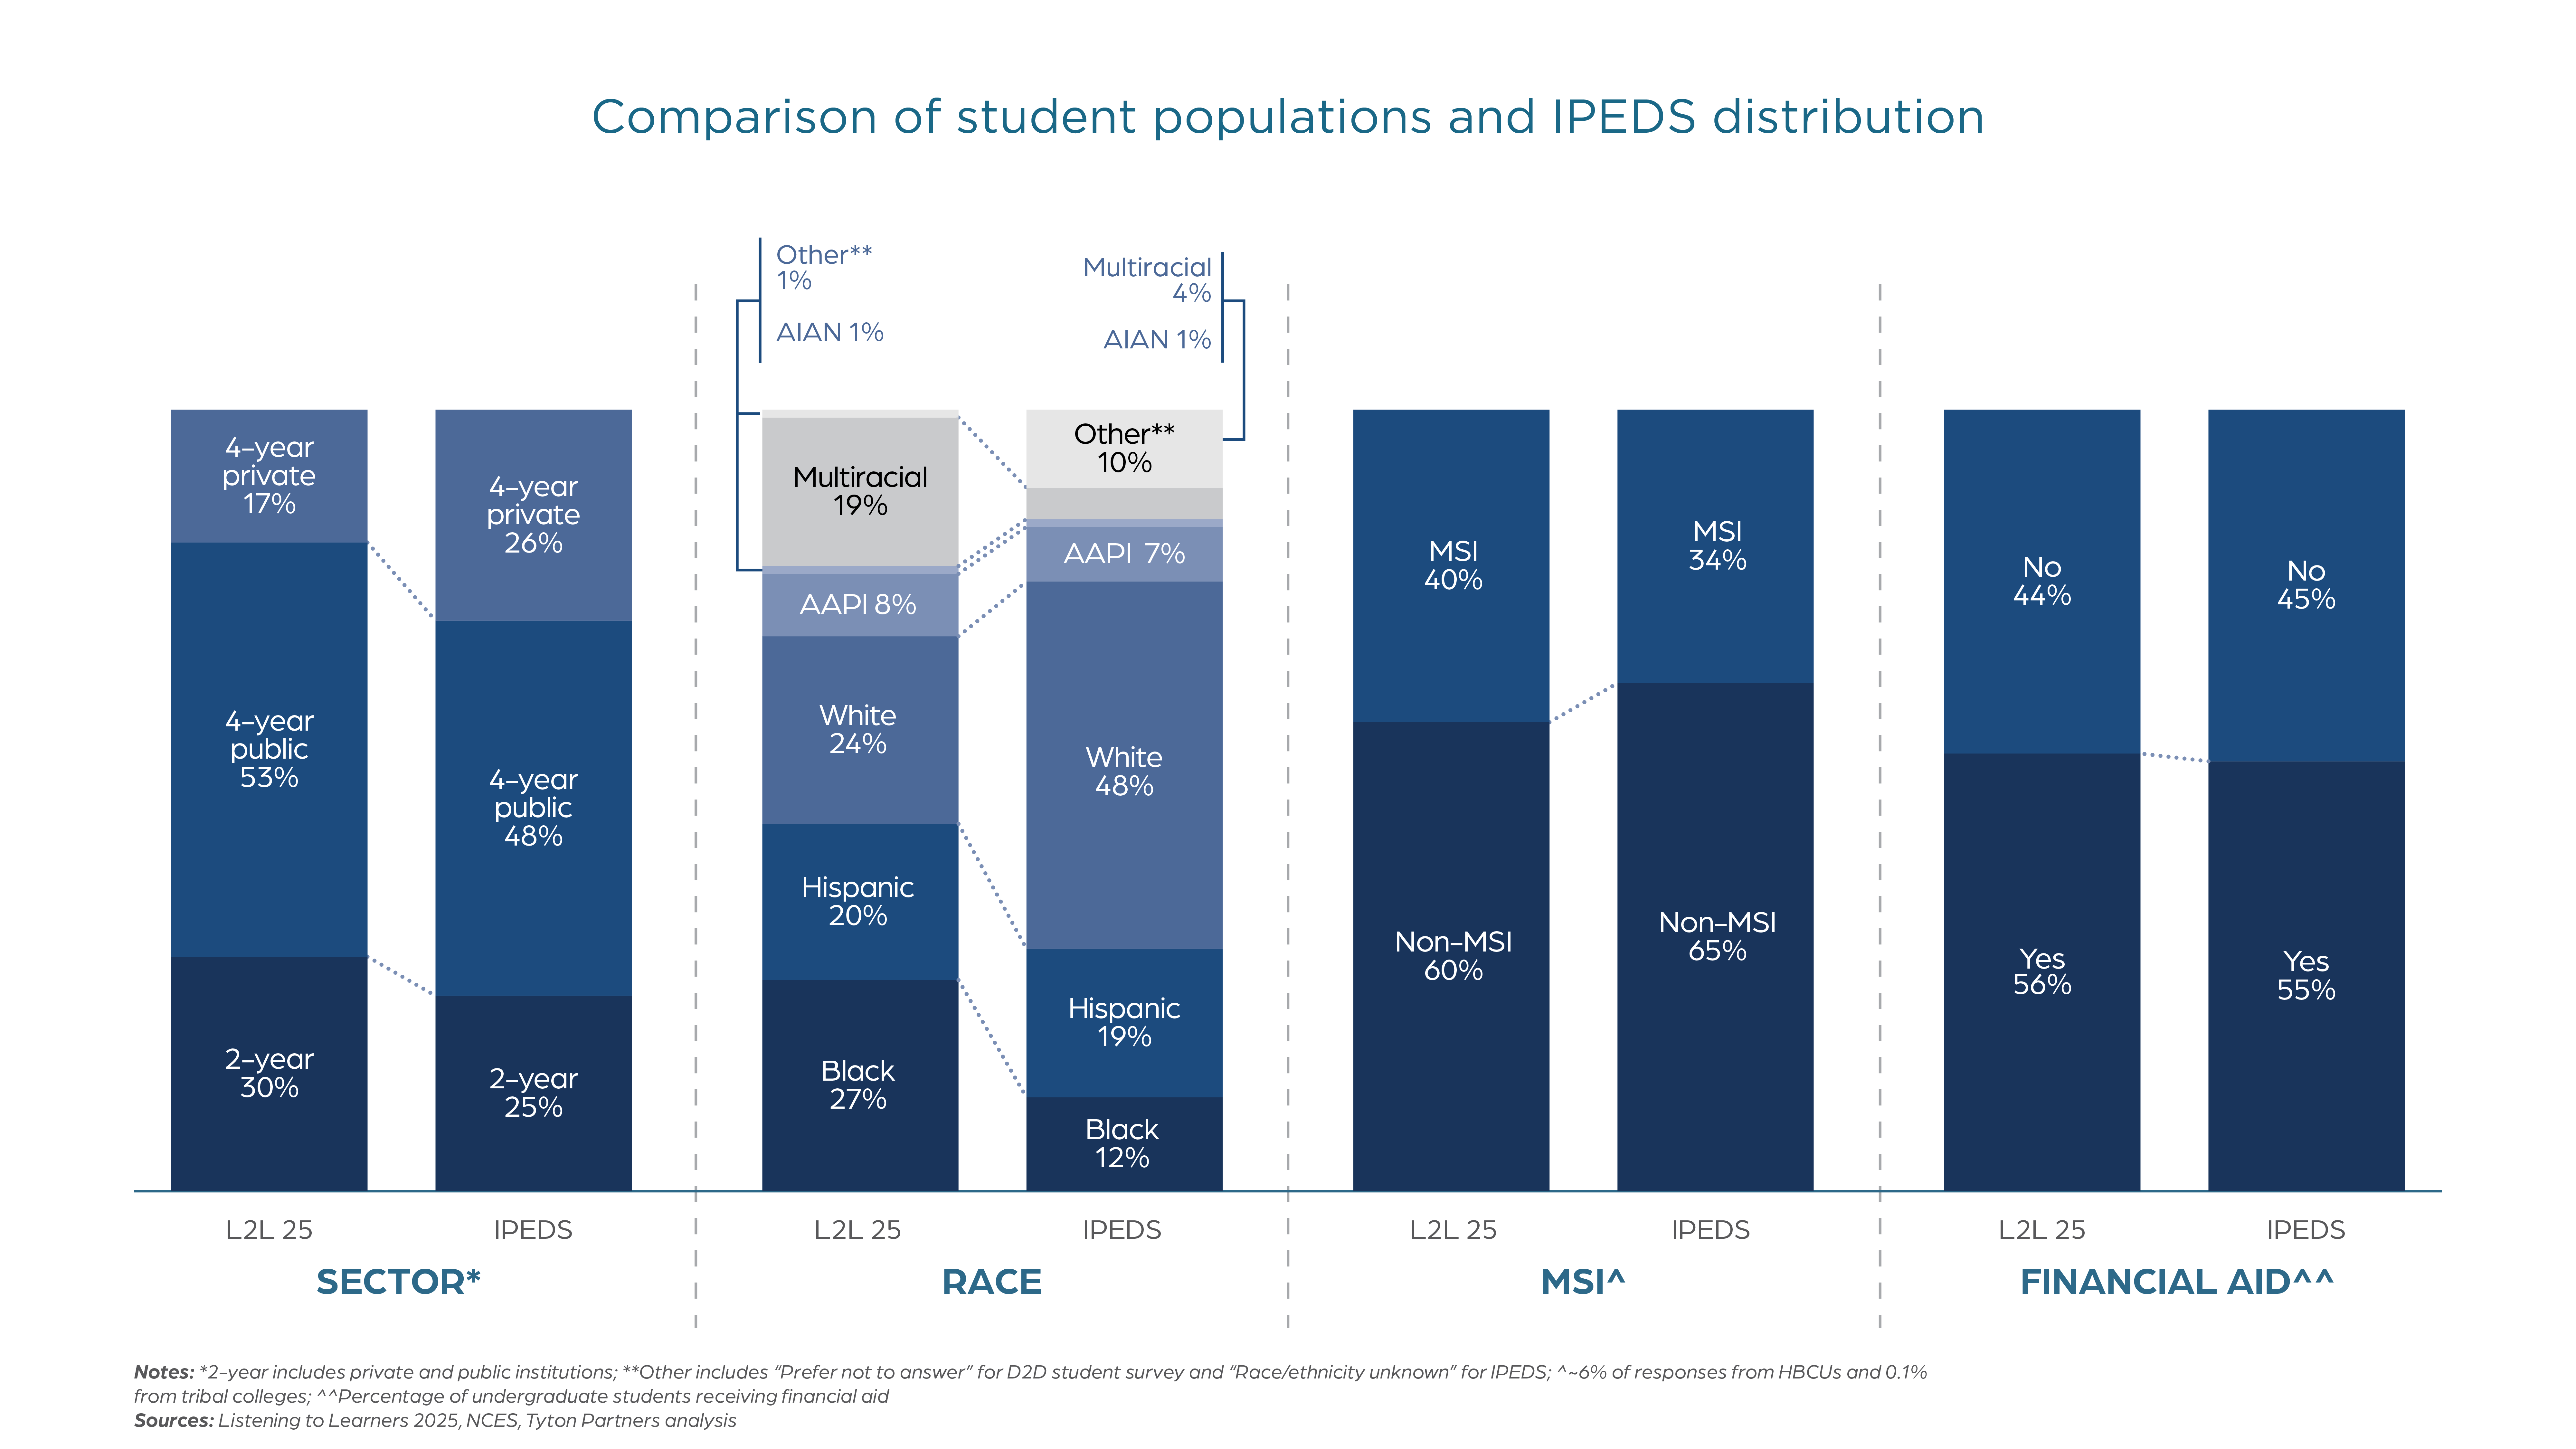
Student survey respondents reflect the composition of the national IPEDS universe, with overrepresentation in representation by race. This sampling was done intentionally to enable statistically significant comparisons between groups.
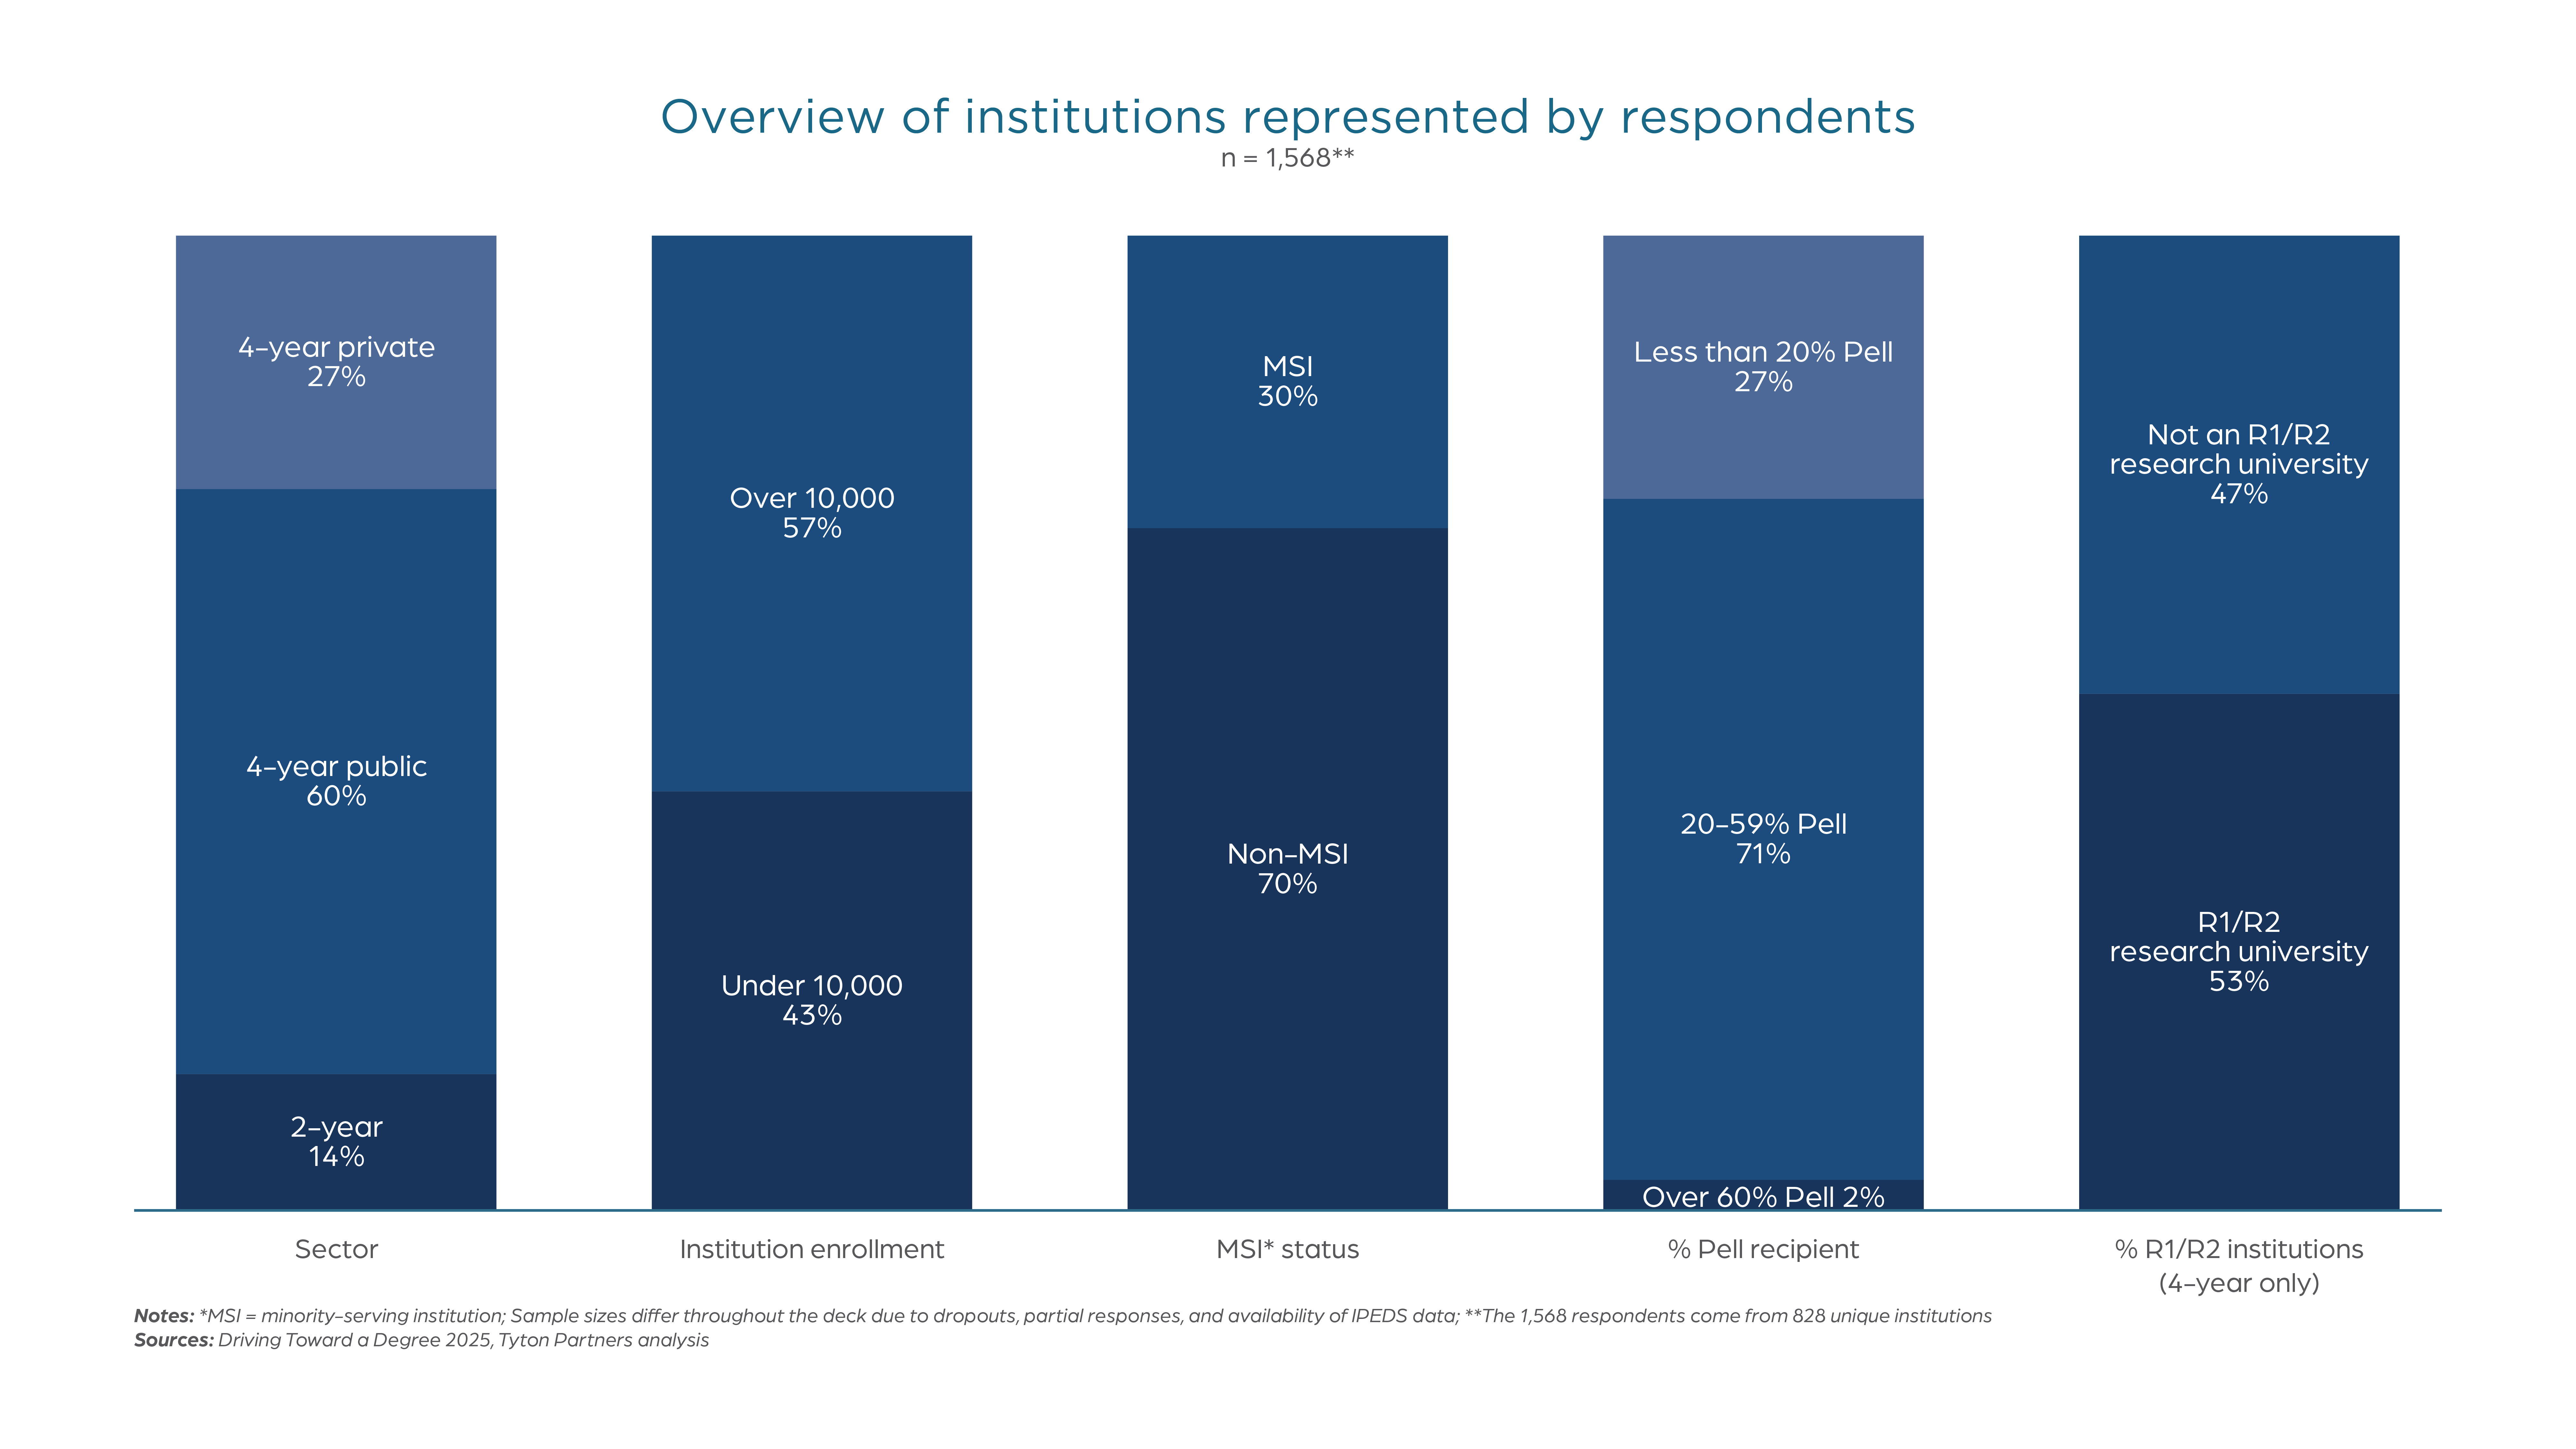
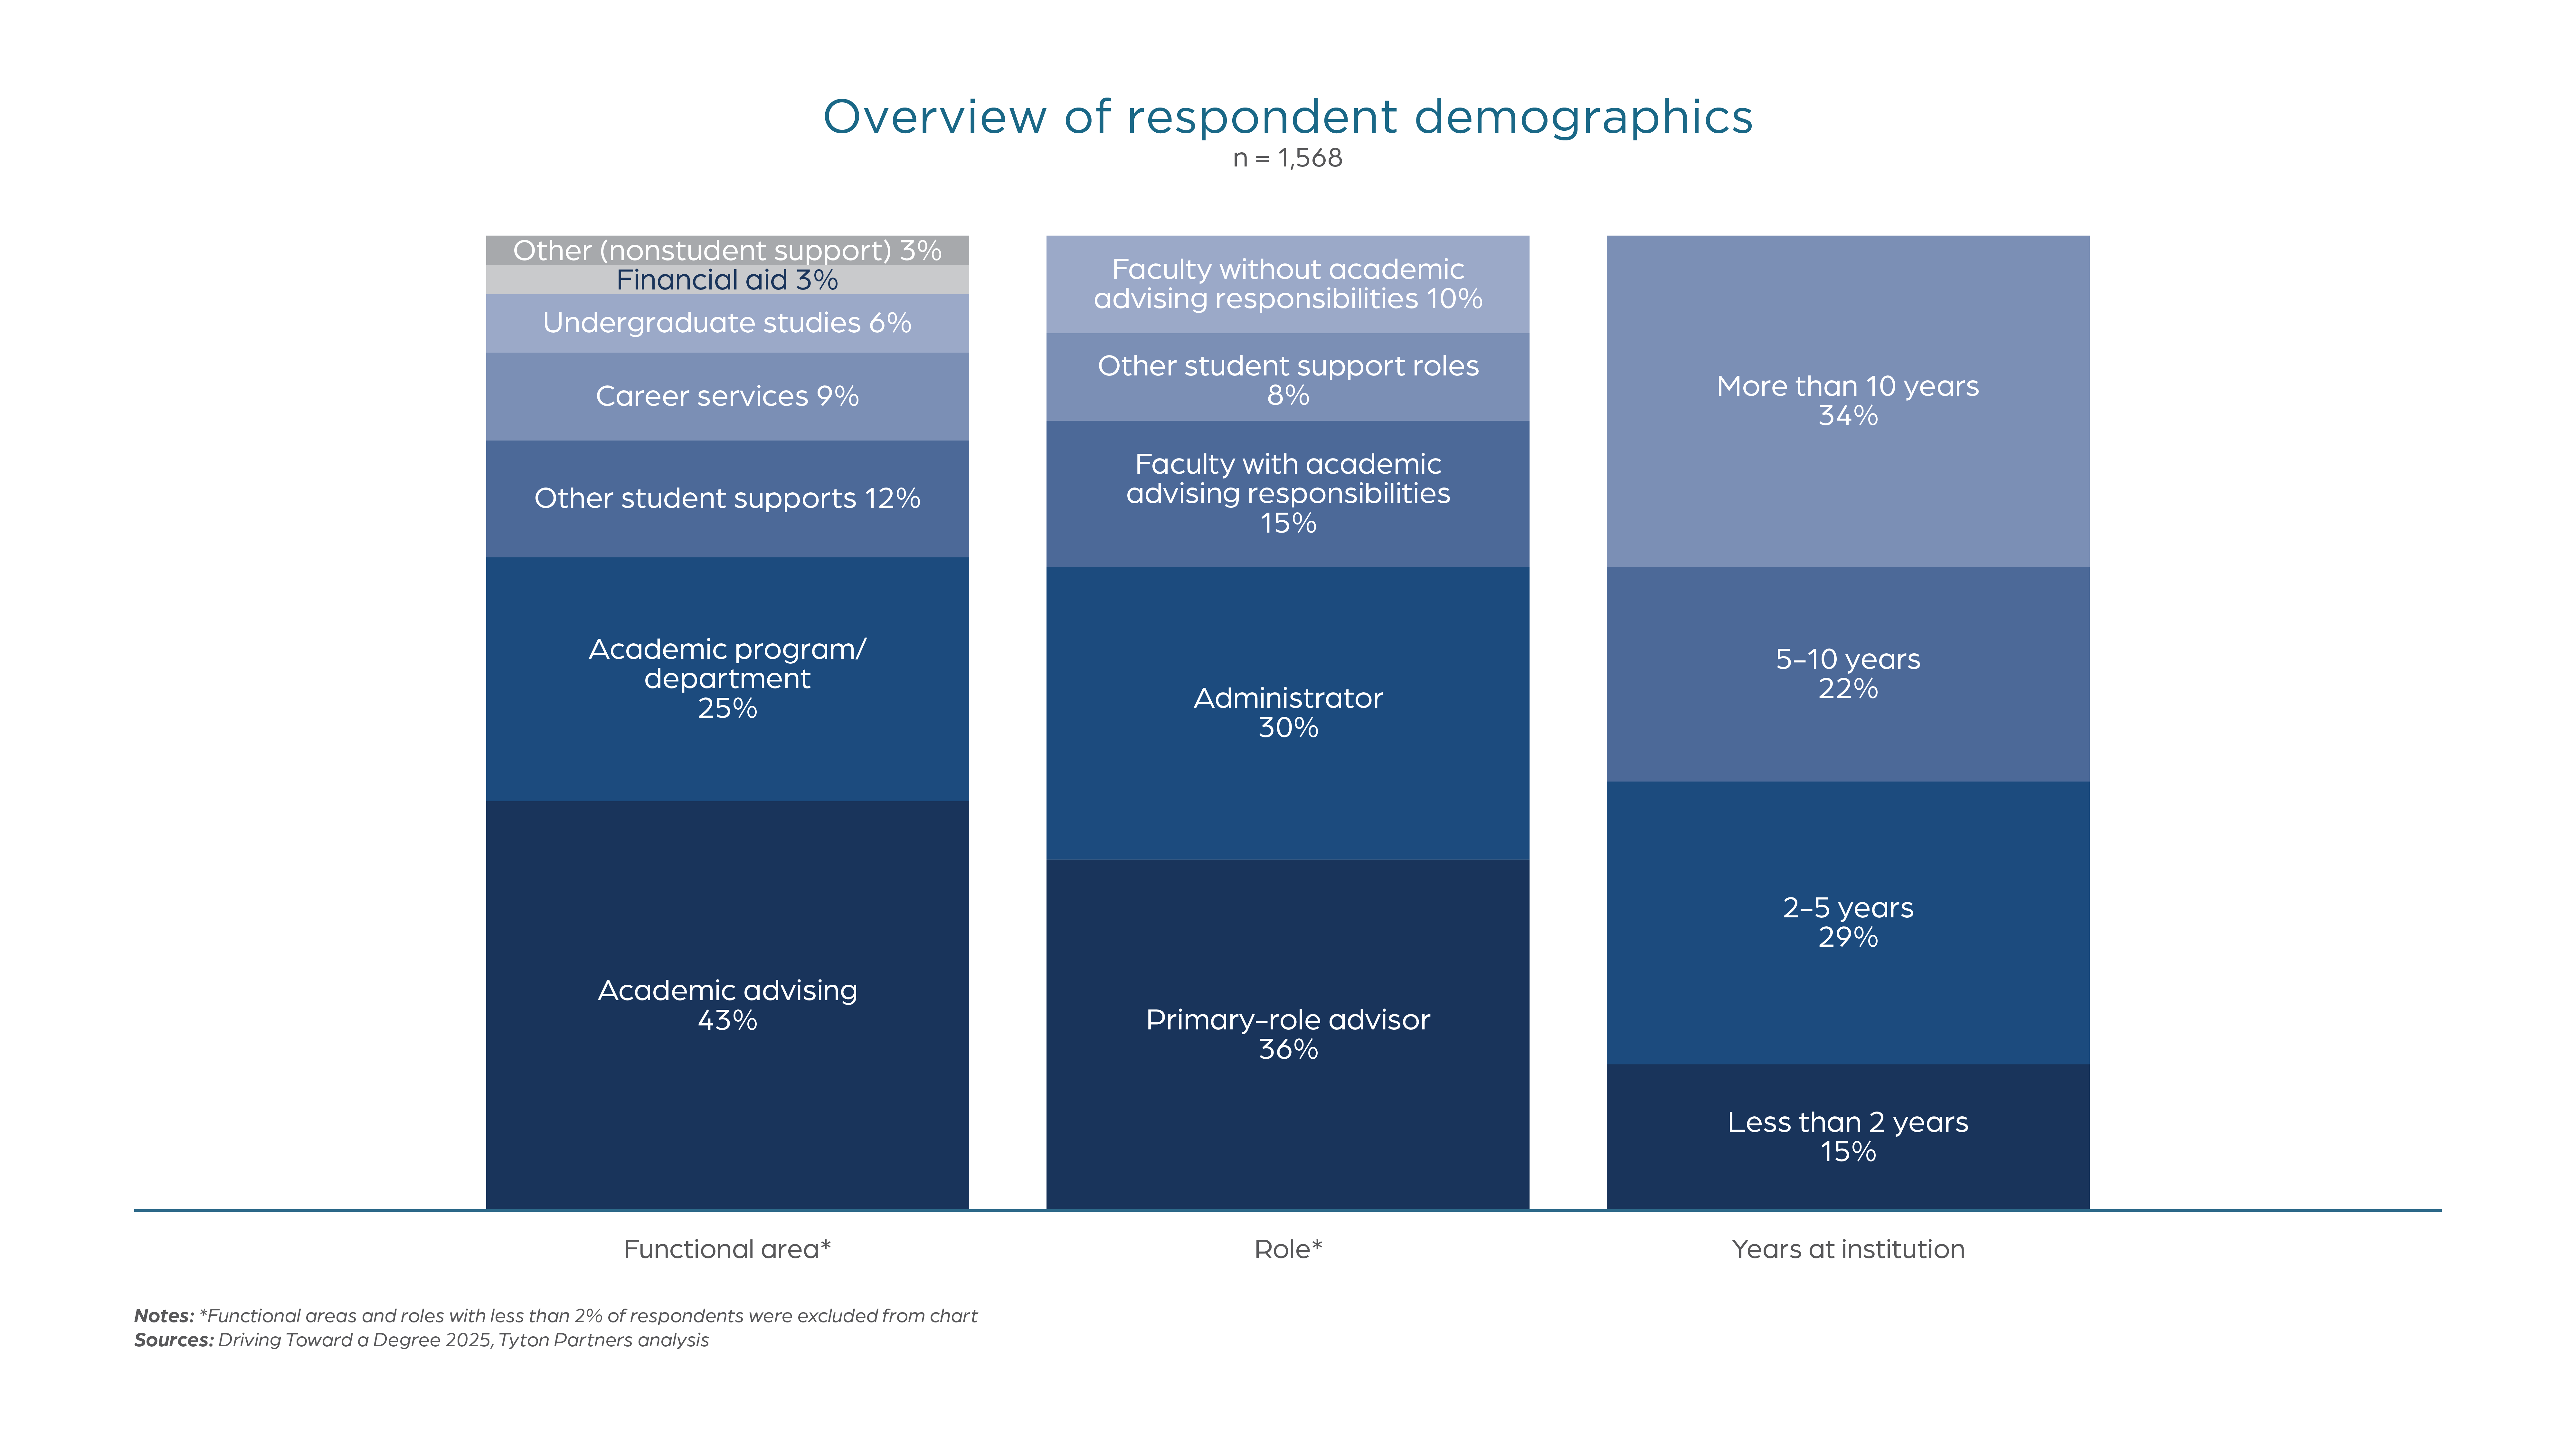
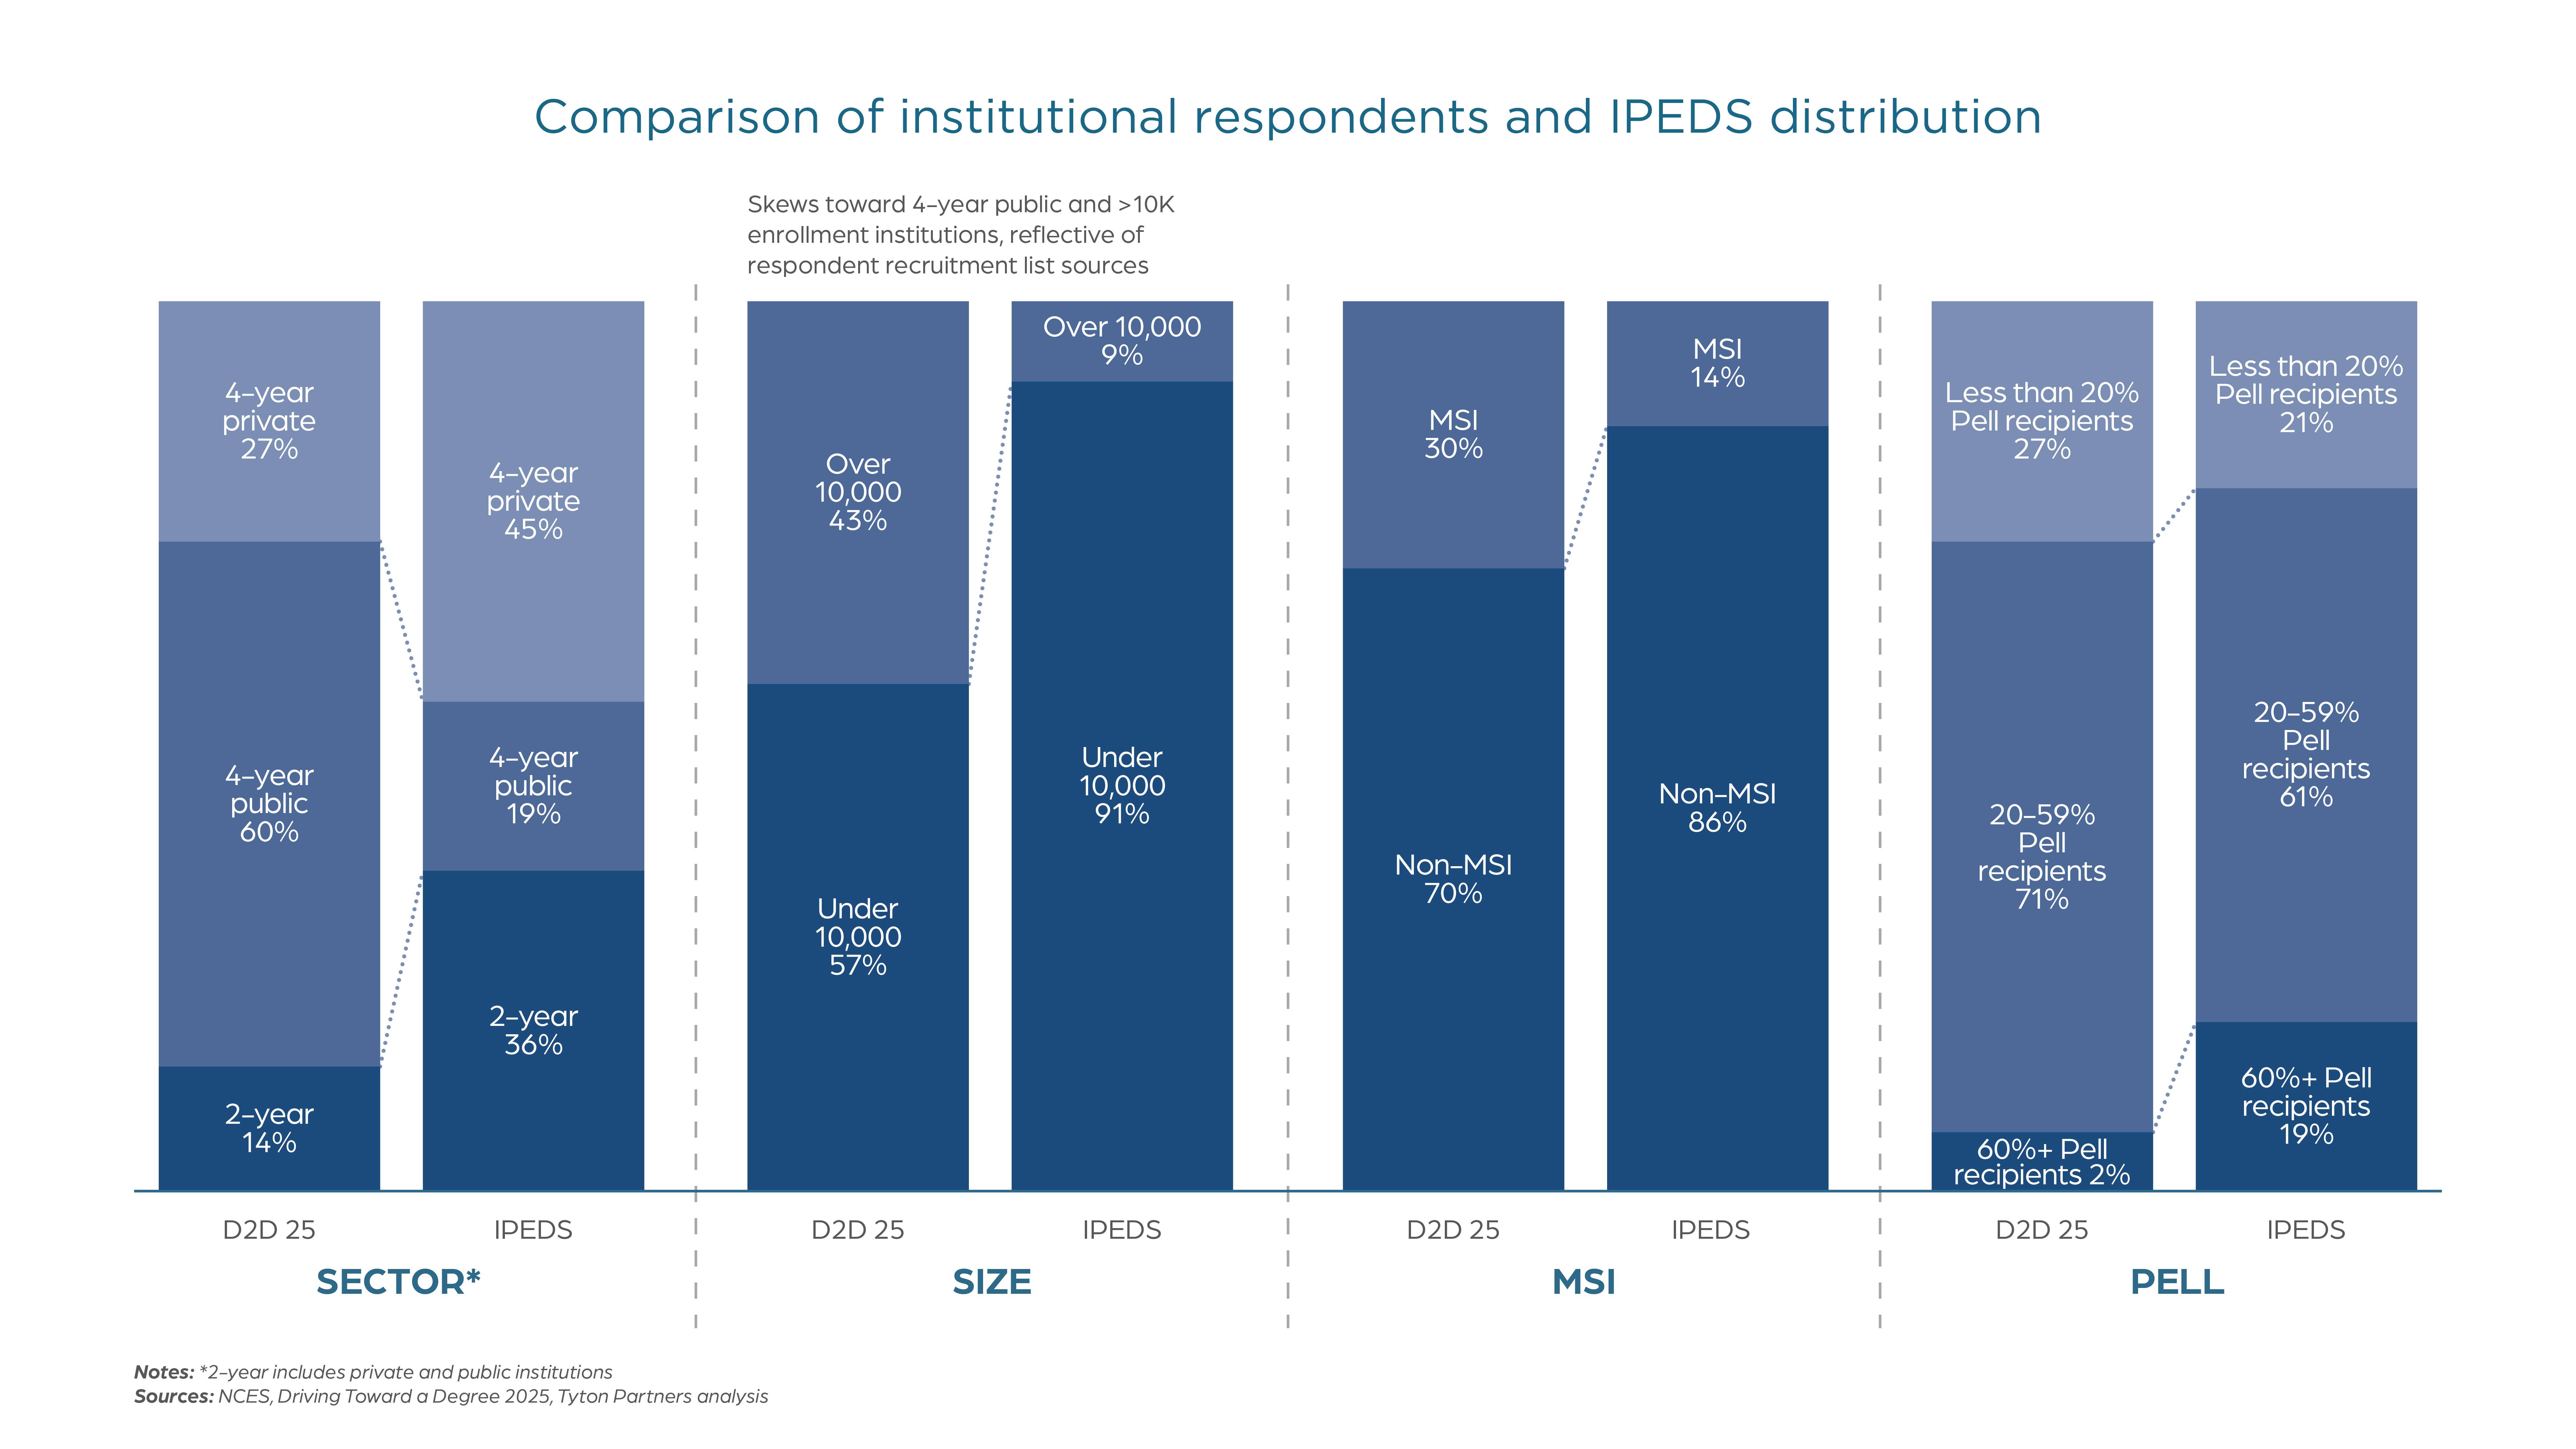
Driving Toward a Degree 2025’s institutional survey received over 1,500 responses, representing over 825 unique institutions…
…as well as diversity in functional area, role, and years of experience; like past years, academic advisors intentionally comprise a large portion of the sample
Institutional survey respondents are mostly white and female with advanced degrees, reflective of the corps of professional academic advisors
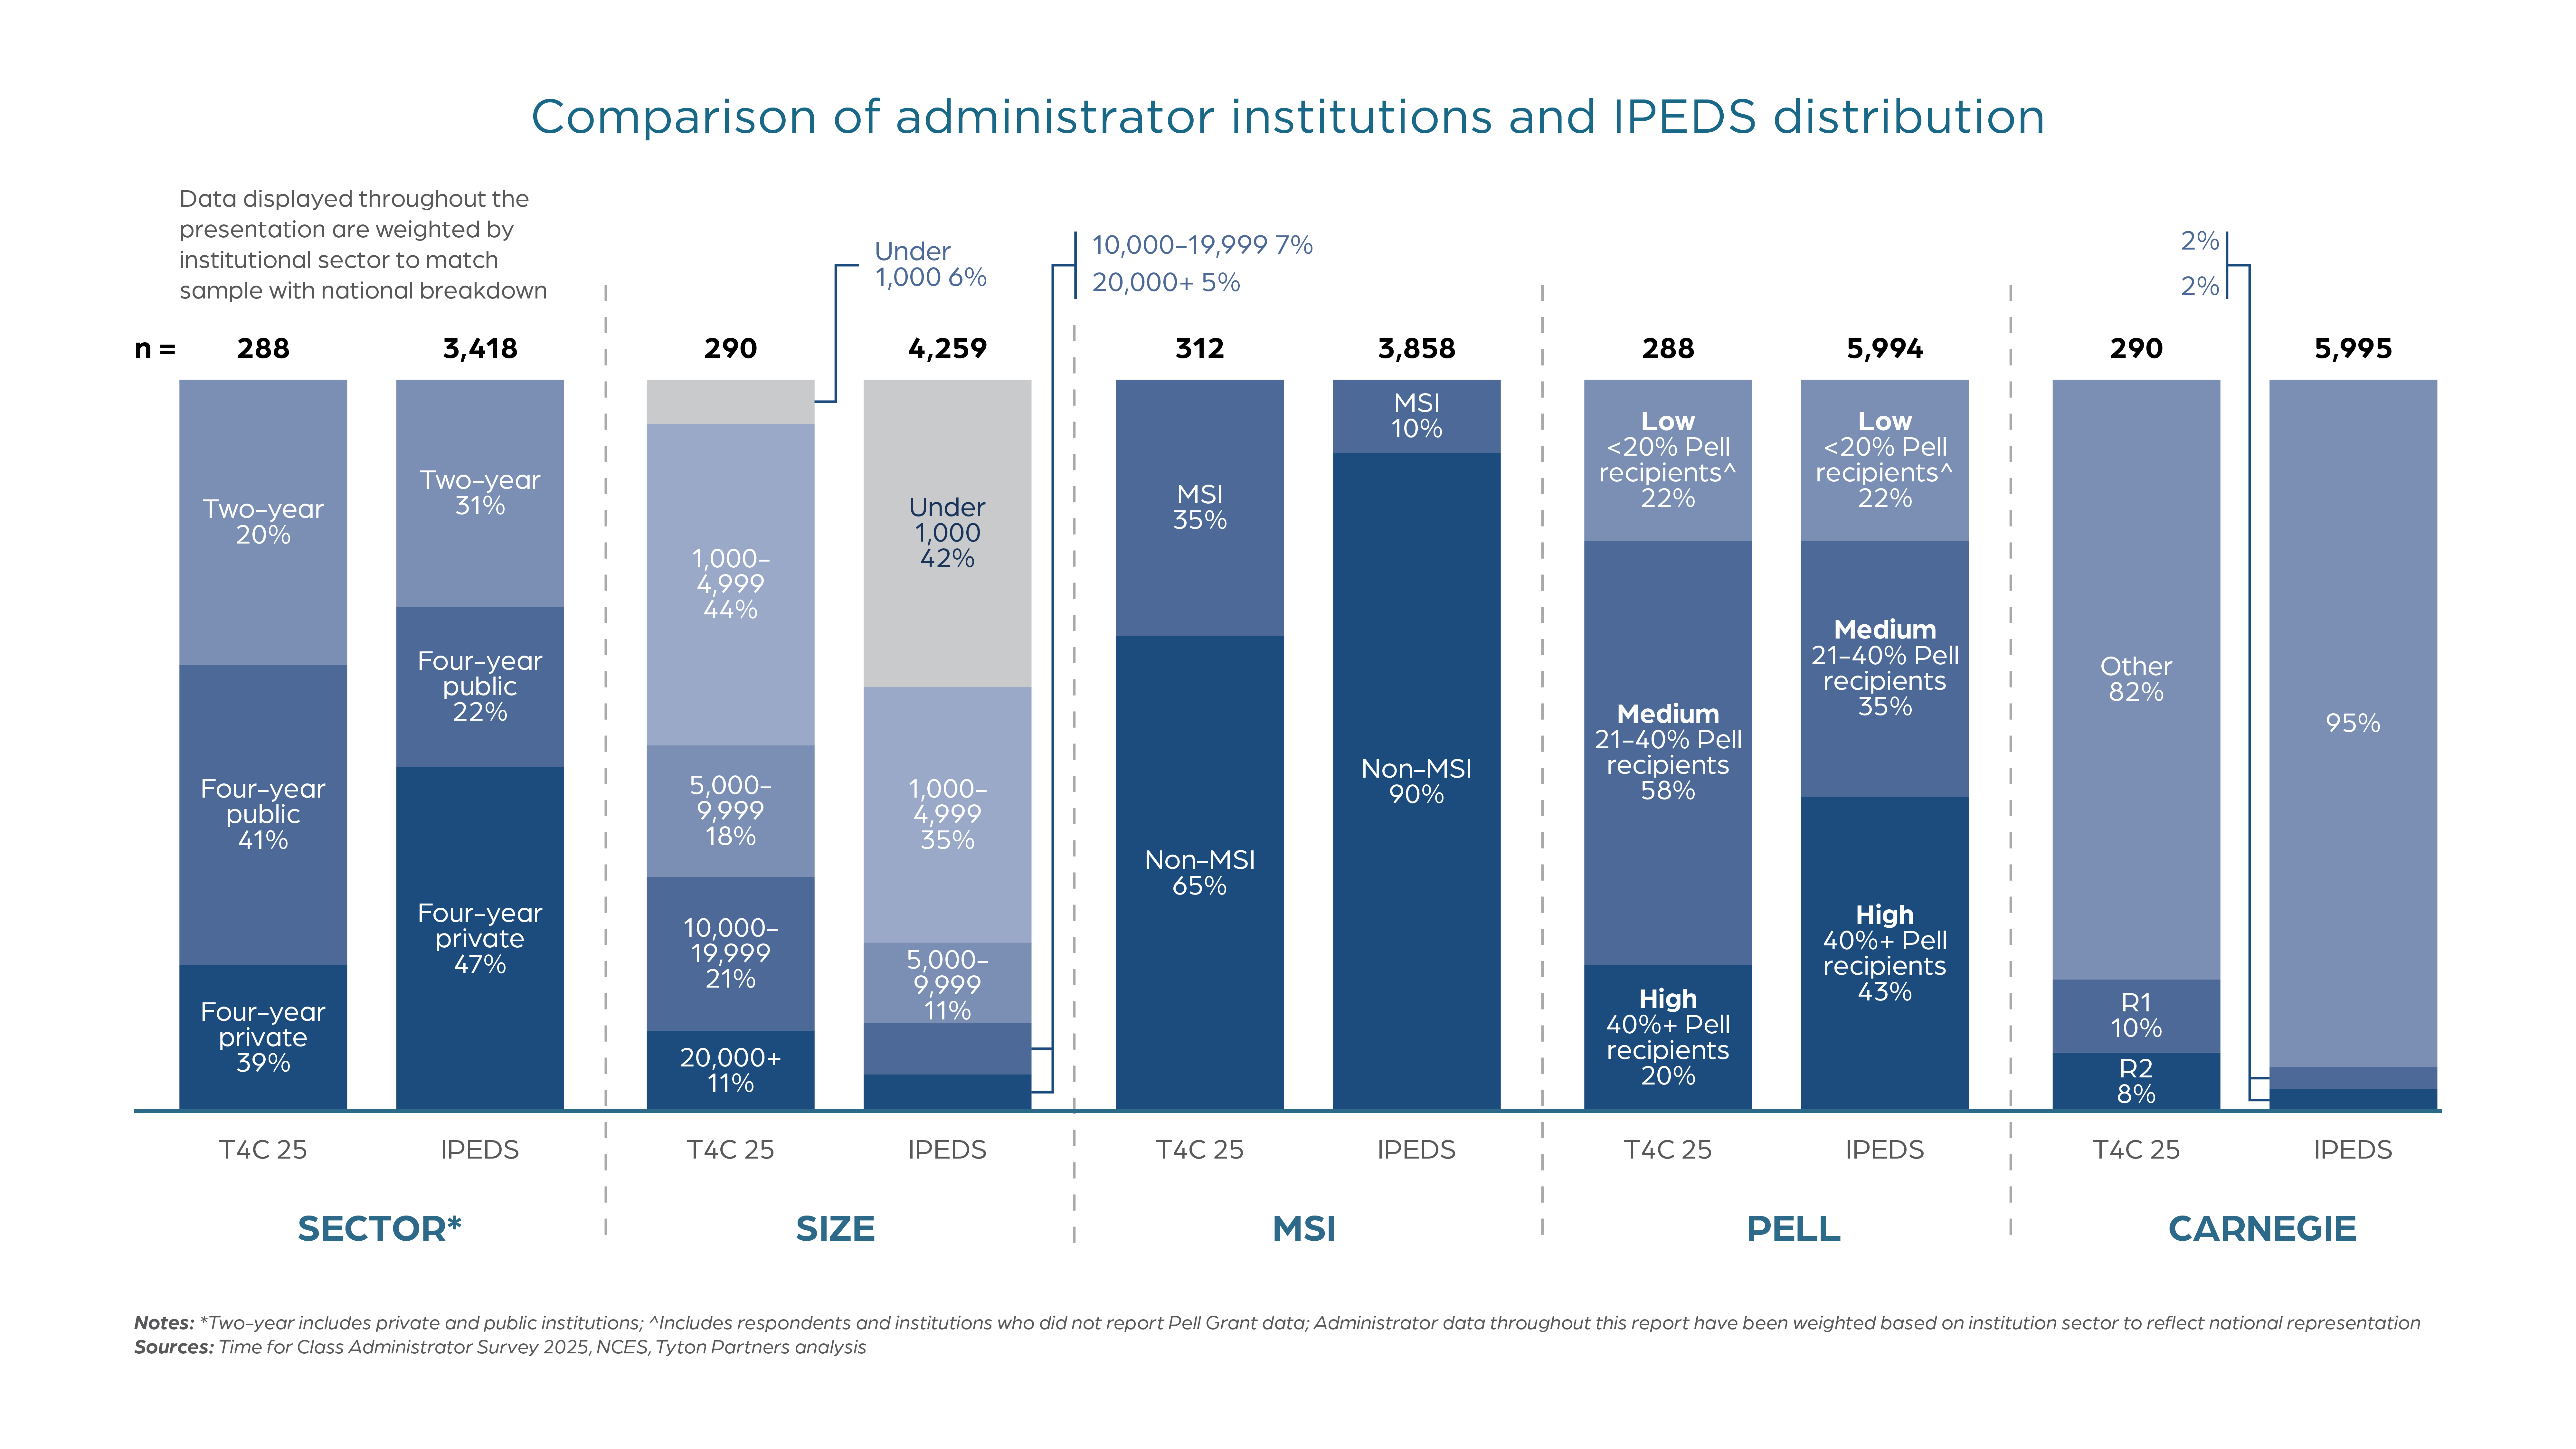
Institutional survey respondents generally reflect the national IPEDS universe; 4-year public institutions, large institutions, and MSIs are overrepresented
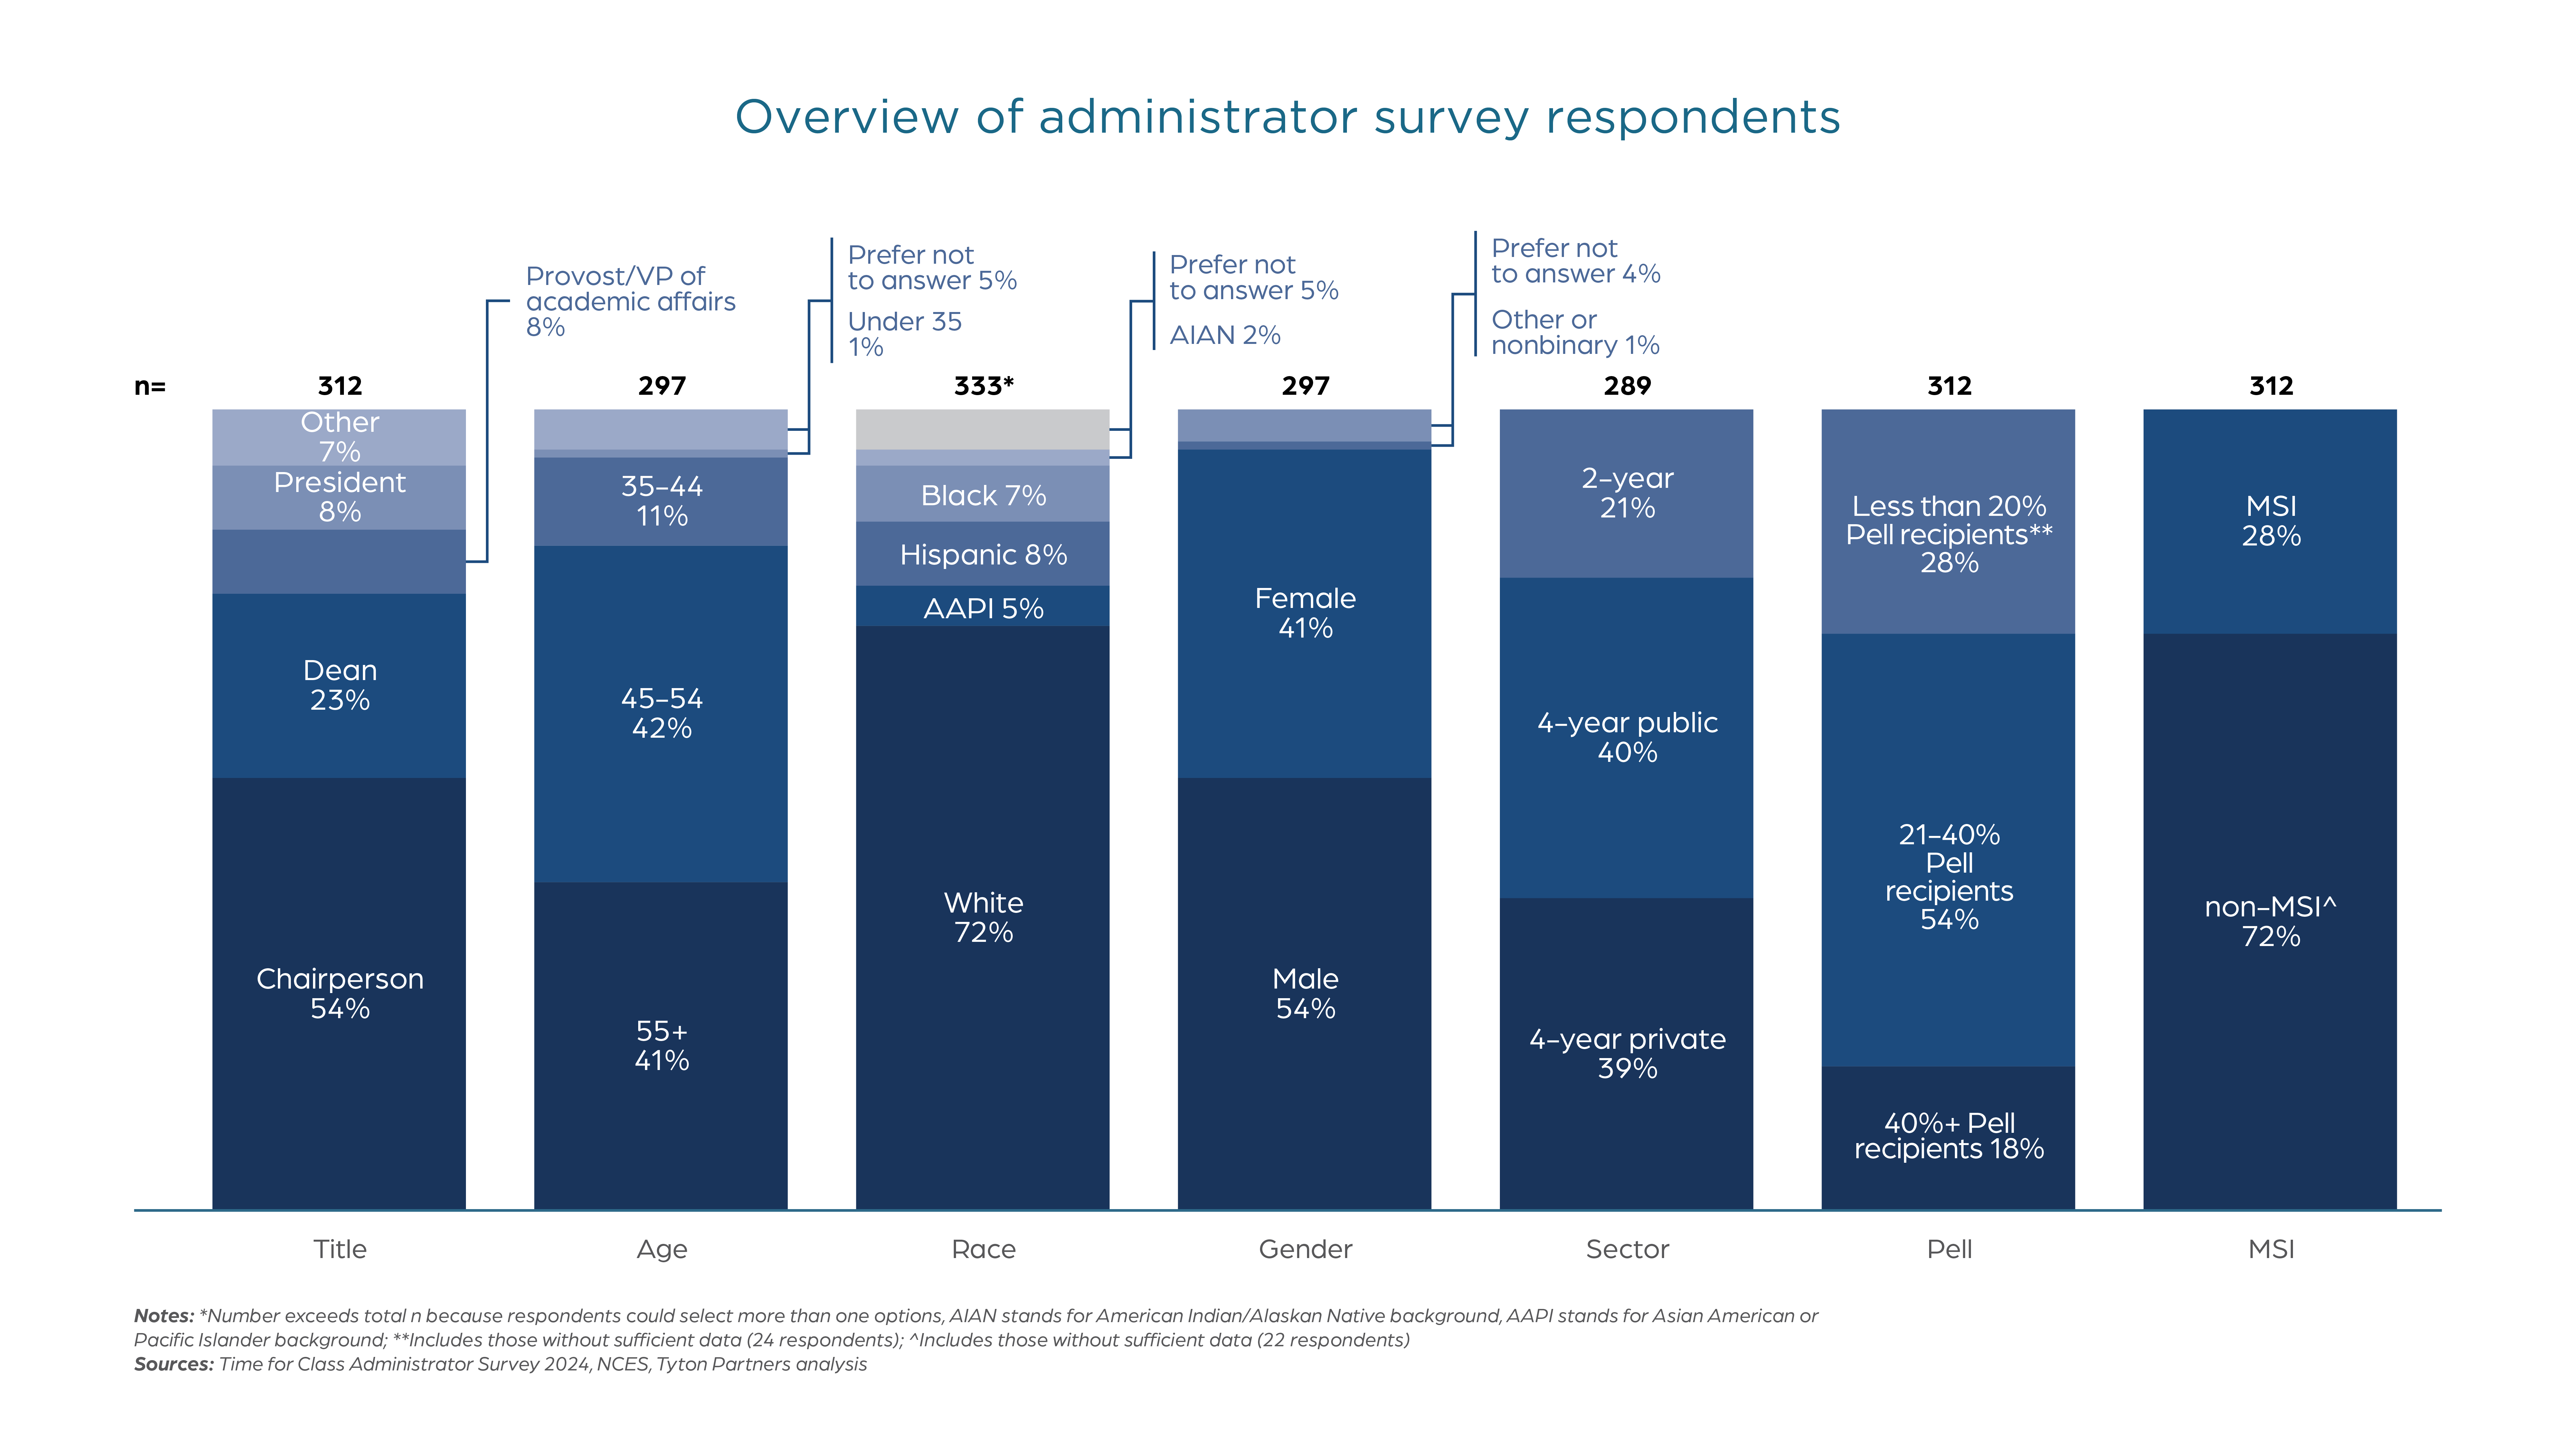
Approximately 300 administrators responded to Time for Class 2025, representing over 250 unique institutions
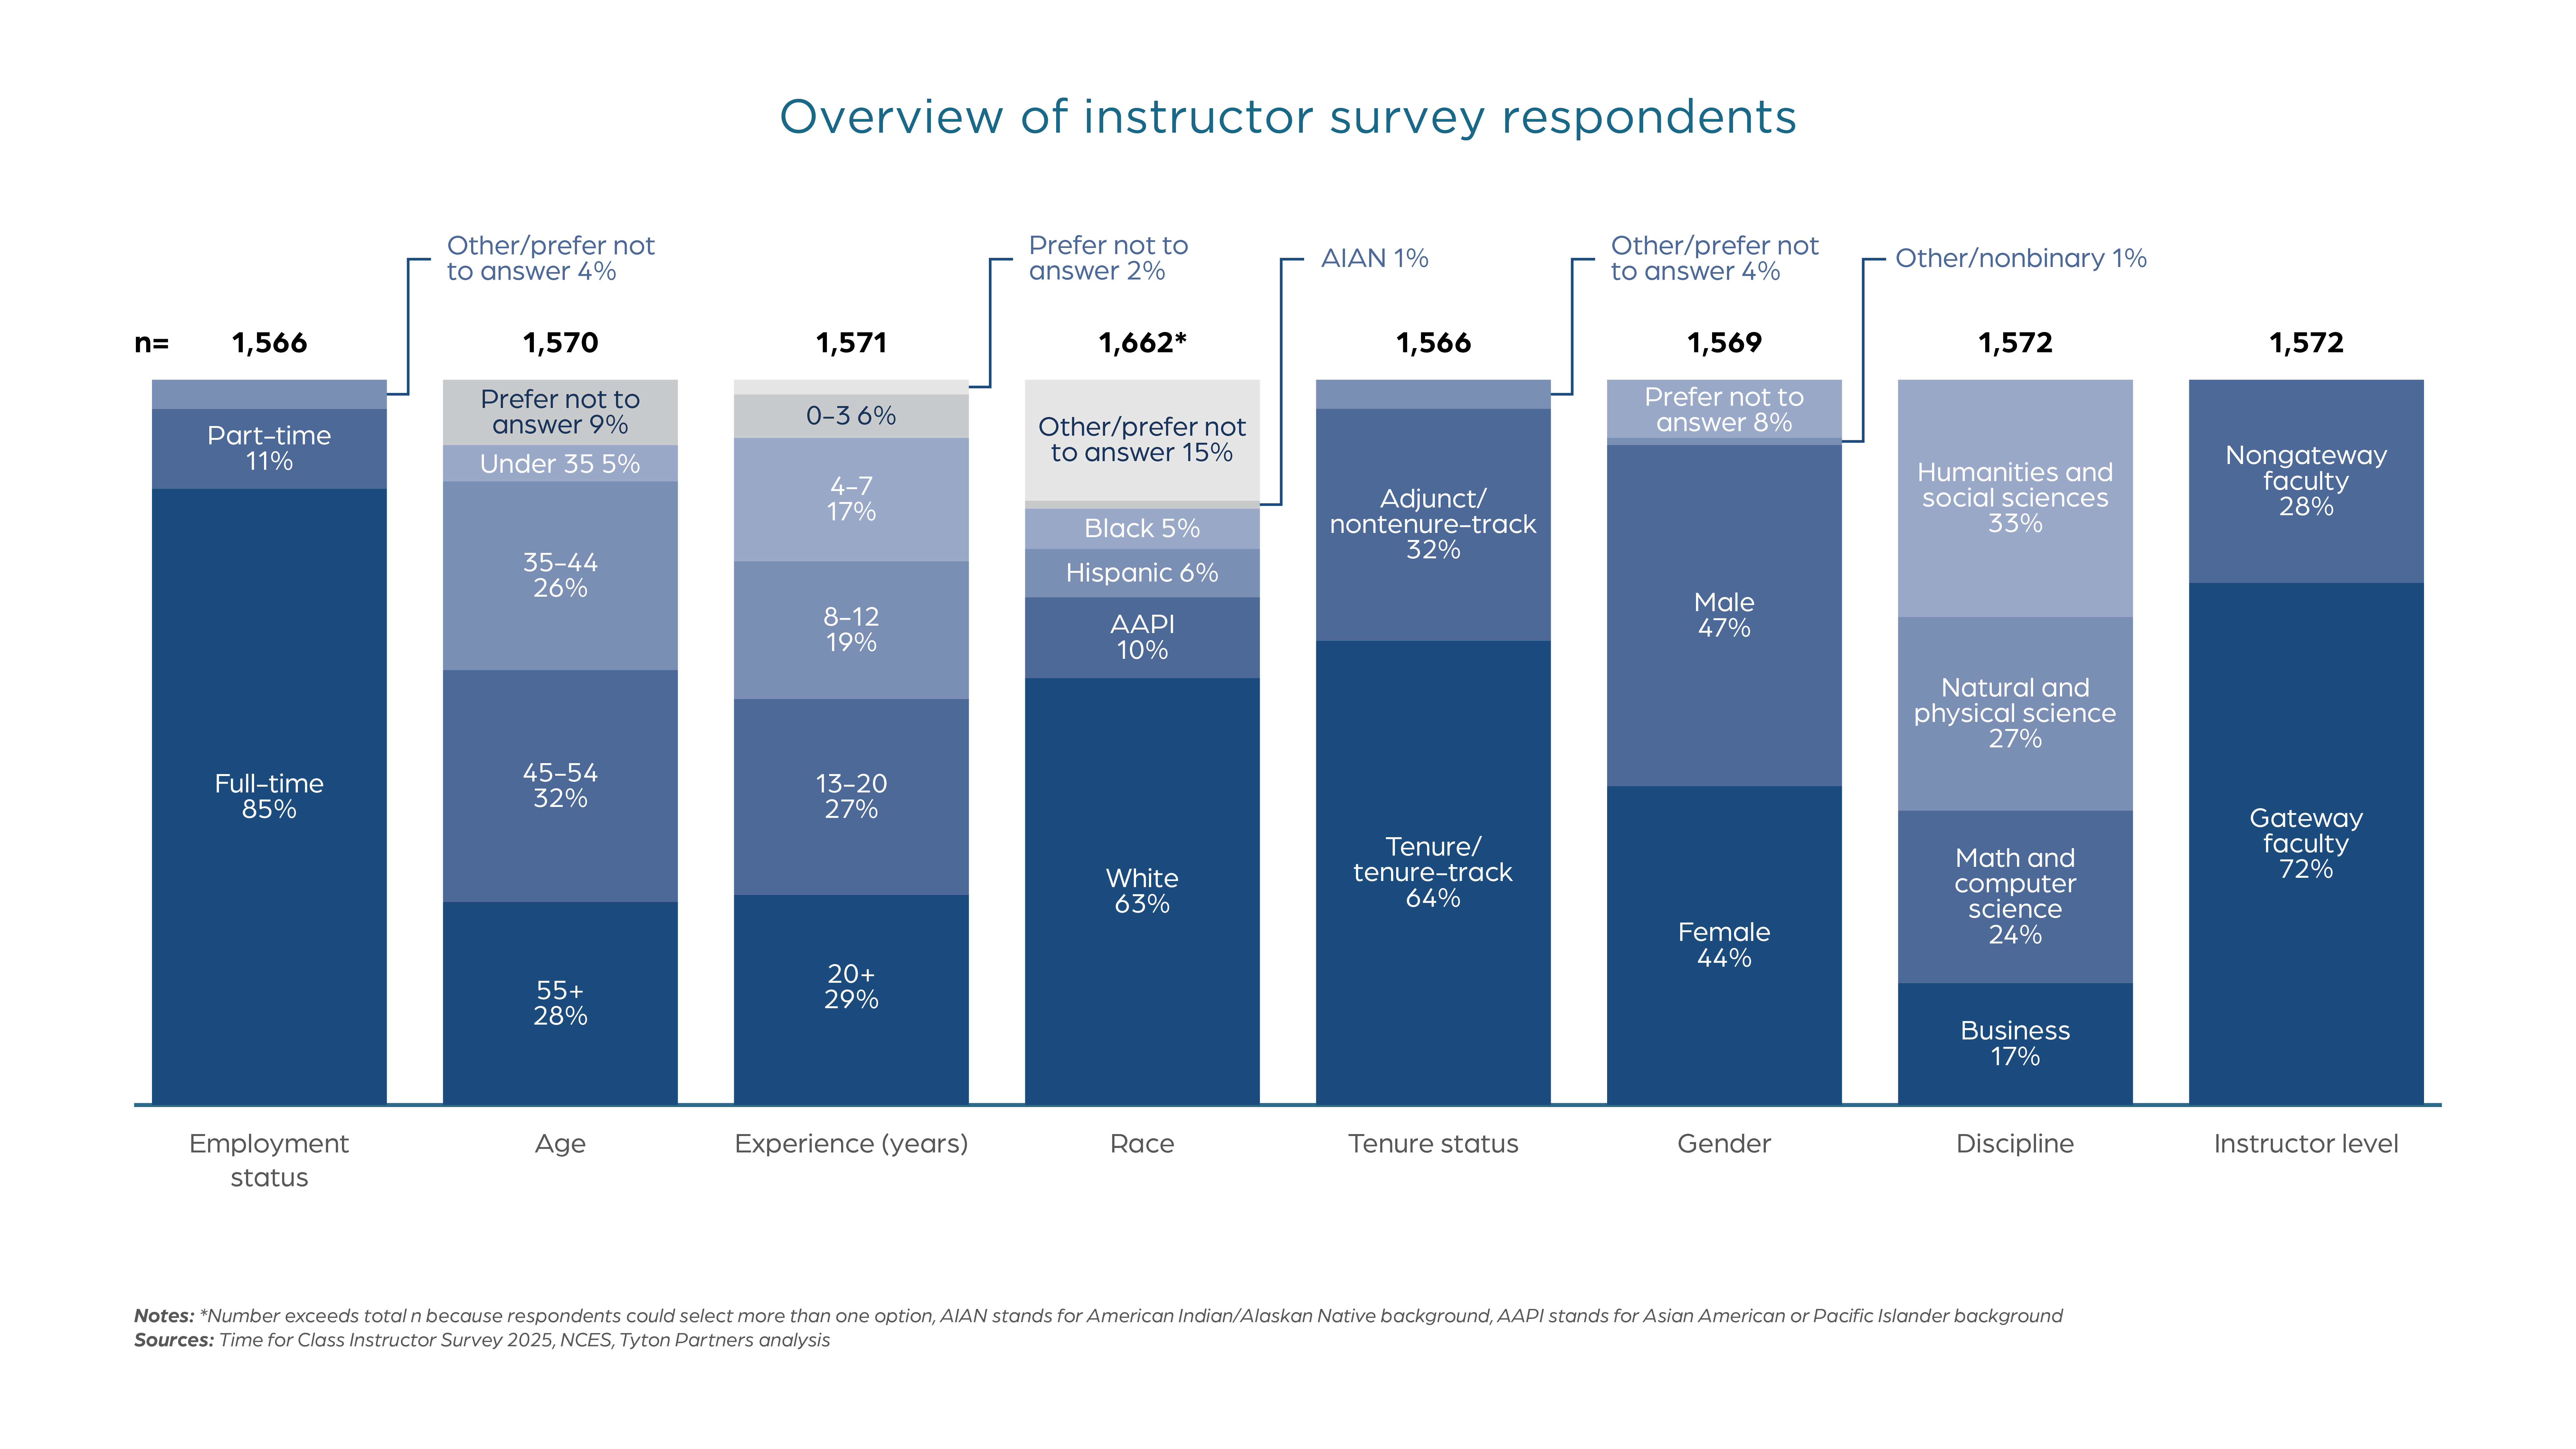
Approximately 1,500 instructors responded to Time for Class 2025, representing nearly 700 unique institutions
4-year public institutions are overrepresented in the administrator survey as are MSIs; small institutions are underrepresented
Large, 4-year public institutions are overrepresented in the faculty survey as are MSIs